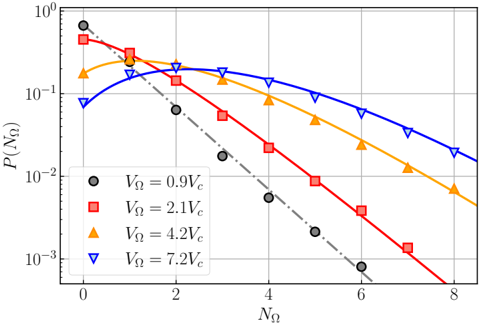
## Chart: Probability Distribution of NΩ
### Overview
The image presents a chart illustrating the probability distribution P(NΩ) as a function of NΩ for different values of VΩ. The chart uses a logarithmic scale for the y-axis (P(NΩ)) and a linear scale for the x-axis (NΩ). Four distinct lines represent the probability distributions for VΩ values of 0.9V𝑐, 2.1V𝑐, 4.2V𝑐, and 7.2V𝑐.
### Components/Axes
* **X-axis:** Labeled "NΩ", ranging from approximately 0 to 8.
* **Y-axis:** Labeled "P(NΩ)", on a logarithmic scale, ranging from approximately 10⁻³ to 10⁰ (or 1).
* **Legend:** Located in the bottom-left corner, listing the following data series:
* Black circles: VΩ = 0.9V𝑐
* Red squares: VΩ = 2.1V𝑐
* Orange triangles: VΩ = 4.2V𝑐
* Blue triangles: VΩ = 7.2V𝑐
* **Grid:** A grid is present to aid in reading values from the chart.
* **Vertical dashed line:** A vertical dashed line is present at approximately NΩ = 2.
### Detailed Analysis
* **VΩ = 0.9V𝑐 (Black circles):** The line starts at approximately P(NΩ) = 0.9 at NΩ = 0, decreases rapidly, reaching approximately P(NΩ) = 0.01 at NΩ = 4, and continues to decrease, reaching approximately P(NΩ) = 0.001 at NΩ = 7. The trend is a steep downward slope.
* **VΩ = 2.1V𝑐 (Red squares):** The line starts at approximately P(NΩ) = 0.2 at NΩ = 0, initially decreases, reaches a minimum around NΩ = 1.5 at approximately P(NΩ) = 0.08, then increases slightly before decreasing again. At NΩ = 8, P(NΩ) is approximately 0.01. The trend is initially decreasing, then slightly increasing, and finally decreasing.
* **VΩ = 4.2V𝑐 (Orange triangles):** The line starts at approximately P(NΩ) = 0.1 at NΩ = 0, increases to a maximum around NΩ = 1.5 at approximately P(NΩ) = 0.15, then decreases. At NΩ = 8, P(NΩ) is approximately 0.03. The trend is increasing initially, then decreasing.
* **VΩ = 7.2V𝑐 (Blue triangles):** The line starts at approximately P(NΩ) = 0.1 at NΩ = 0, increases to a maximum around NΩ = 2 at approximately P(NΩ) = 0.13, then decreases. At NΩ = 8, P(NΩ) is approximately 0.02. The trend is increasing initially, then decreasing.
### Key Observations
* The probability distributions for all VΩ values decrease as NΩ increases, but the rate of decrease varies.
* The distributions for VΩ = 4.2V𝑐 and VΩ = 7.2V𝑐 exhibit a peak before decreasing, suggesting a most probable value of NΩ around 1.5-2.
* The distribution for VΩ = 0.9V𝑐 shows a monotonic decrease, indicating that higher values of NΩ are less probable.
* The vertical dashed line at NΩ = 2 appears to mark a transition point where the distributions for VΩ = 4.2V𝑐 and VΩ = 7.2V𝑐 begin to decrease more rapidly.
### Interpretation
The chart demonstrates how the probability distribution of NΩ changes with different values of VΩ. The parameter VΩ likely represents a potential or voltage, and NΩ could represent a related quantity, possibly the number of events or particles. The shape of the distributions suggests that the system's behavior is sensitive to the value of VΩ.
The peak observed in the distributions for higher VΩ values indicates that there is a preferred value of NΩ for those conditions. As VΩ increases, the peak shifts slightly to the right, suggesting that the preferred value of NΩ also increases. The monotonic decrease for the lowest VΩ value suggests that the system is less likely to exhibit a preferred value of NΩ under those conditions.
The vertical dashed line at NΩ = 2 might represent a threshold or critical point where the system's behavior changes significantly. The fact that the distributions for higher VΩ values start to decrease more rapidly after this point suggests that the system becomes less stable or more prone to fluctuations beyond this threshold.
The logarithmic scale on the y-axis emphasizes the relative probabilities of different NΩ values. The steep slopes observed for some of the lines indicate that small changes in NΩ can lead to significant changes in probability.