## Line Graph: BF16 v.s. FP8 on Ling-1T
### Overview
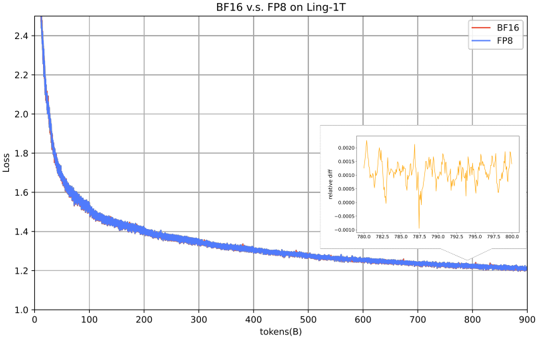
The image is a line graph comparing the performance of two computational models, BF16 and FP8, on the Ling-1T dataset. The primary graph shows loss values plotted against token counts (in billions), while an inset graph displays the relative difference between the two models. The data suggests a convergence in performance between the models as token counts increase.
### Components/Axes
- **Main Graph**:
- **X-axis**: "tokens(B)" (tokens in billions), ranging from 0 to 900.
- **Y-axis**: "Loss", ranging from 1.0 to 2.4.
- **Legend**: Located in the top-right corner, with:
- **BF16**: Red line.
- **FP8**: Blue line.
- **Inset Graph**:
- **X-axis**: "tokens(B)", ranging from 780 to 800.
- **Y-axis**: "relative diff", ranging from -0.0005 to 0.0002.
- **Legend**: Orange line labeled "relative diff".
### Detailed Analysis
- **BF16 (Red Line)**:
- Starts at approximately **2.4 loss** at 0 tokens.
- Drops sharply to ~1.2 loss by 100 tokens.
- Gradually plateaus near **1.2 loss** between 100 and 900 tokens.
- **FP8 (Blue Line)**:
- Starts at approximately **1.8 loss** at 0 tokens.
- Drops to ~1.2 loss by 100 tokens.
- Remains stable near **1.2 loss** for the remainder of the range.
- **Inset Graph**:
- Shows the **relative difference** between BF16 and FP8 loss values.
- Oscillates between **-0.0005 and 0.0002**, with peaks and troughs indicating minor fluctuations in performance parity.
- Highest relative difference (~0.0002) occurs near 780 tokens.
- Lowest relative difference (~-0.0005) occurs near 797.5 tokens.
### Key Observations
1. **Convergence**: Both models converge to similar loss values (~1.2) after ~100 tokens, suggesting comparable efficiency at scale.
2. **Initial Disparity**: BF16 begins with a higher loss (~2.4 vs. FP8's ~1.8) but narrows the gap rapidly.
3. **Relative Stability**: The inset graph reveals minimal divergence (<0.0005) between the models at higher token counts, indicating near-identical performance in later stages.
4. **Fluctuations**: The inset's jagged line suggests minor, transient differences in performance, possibly due to hardware-specific optimizations or noise in the dataset.
### Interpretation
The data demonstrates that BF16 and FP8 achieve similar loss values after processing ~100 tokens, with BF16 initially underperforming but catching up. The relative difference inset highlights that their performance becomes nearly indistinguishable at higher token counts, with differences too small to impact practical outcomes. The oscillations in the inset may reflect minor variations in computational efficiency or dataset-specific anomalies. This suggests that both models are viable for large-scale tasks on Ling-1T, with no significant long-term advantage for either.