## Line Chart: Benchmark: AMC23
### Overview
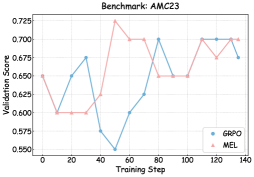
The image displays a line chart comparing the performance of two methods, labeled "GRPO" and "MEL," over the course of training. The chart tracks a "Validation Score" against "Training Step." The overall trend shows both methods starting at a similar performance level, experiencing significant volatility, and ending at comparable but distinct final scores.
### Components/Axes
* **Chart Title:** "Benchmark: AMC23" (centered at the top).
* **Y-Axis:** Labeled "Validation Score." The scale runs from 0.550 to 0.725, with major tick marks at intervals of 0.025 (0.550, 0.575, 0.600, 0.625, 0.650, 0.675, 0.700, 0.725).
* **X-Axis:** Labeled "Training Step." The scale runs from 0 to 140, with major tick marks at intervals of 20 (0, 20, 40, 60, 80, 100, 120, 140).
* **Legend:** Located in the bottom-right corner of the plot area.
* A blue line with a circular marker is labeled "GRPO".
* A red line with a circular marker is labeled "MEL".
### Detailed Analysis
**Data Series: GRPO (Blue Line)**
* **Trend:** The GRPO line exhibits a volatile, "W"-shaped trend with a significant mid-training dip before recovering.
* **Data Points (Approximate):**
* Step 0: ~0.650
* Step 10: ~0.600
* Step 30: ~0.675
* Step 50: ~0.550 (Global minimum for this series)
* Step 70: ~0.600
* Step 80: ~0.700
* Step 100: ~0.650
* Step 130: ~0.700
* Step 140: ~0.675
**Data Series: MEL (Red Line)**
* **Trend:** The MEL line shows an initial plateau, a sharp rise to a peak, followed by fluctuations at a higher performance band than its start.
* **Data Points (Approximate):**
* Step 0: ~0.650
* Step 10: ~0.600
* Step 30: ~0.600
* Step 50: ~0.725 (Global maximum for the entire chart)
* Step 70: ~0.700
* Step 80: ~0.700
* Step 100: ~0.650
* Step 110: ~0.650
* Step 120: ~0.700
* Step 130: ~0.675
* Step 140: ~0.700
### Key Observations
1. **Initial Convergence:** Both GRPO and MEL begin at the same score (~0.650) and drop to the same low (~0.600) by step 10.
2. **Divergence at Step 50:** This is the most critical point. The GRPO score plummets to its lowest point (~0.550), while the MEL score surges to its highest point (~0.725). This represents the maximum performance gap between the two methods.
3. **Post-Dip Recovery:** After step 50, GRPO shows a strong recovery trend, while MEL experiences a slight decline from its peak but stabilizes at a high level.
4. **Final Comparison:** At the final recorded step (140), MEL (~0.700) holds a slight advantage over GRPO (~0.675).
5. **Volatility:** Both methods demonstrate significant volatility, with scores changing by 0.075 or more between consecutive measured steps.
### Interpretation
The chart suggests that the "MEL" method achieves a higher peak performance and maintains a generally higher validation score after the initial training phase compared to "GRPO." The dramatic divergence at step 50 is the key finding; it indicates a critical phase in training where the two algorithms respond in fundamentally opposite ways. GRPO's severe dip suggests a period of instability or catastrophic forgetting, from which it successfully recovers. MEL's corresponding spike indicates a highly effective learning update at that stage.
The fact that both methods start and end relatively close to each other, despite the mid-training chaos, implies that the final model performance might be similar, but the training dynamics and reliability differ greatly. MEL appears more robust after step 50, while GRPO's path is more erratic. For a technical document, this chart would argue that MEL offers more stable and higher peak performance during the observed training window, though the ultimate final performance gap is modest. The investigation would focus on understanding the algorithmic difference that causes the step 50 divergence.