# Technical Data Extraction: MoSe2 Simulation Plots
This document provides a detailed technical extraction of the data and visual components from the provided image, which consists of two side-by-side heatmaps with superimposed vector streamlines.
## 1. General Metadata
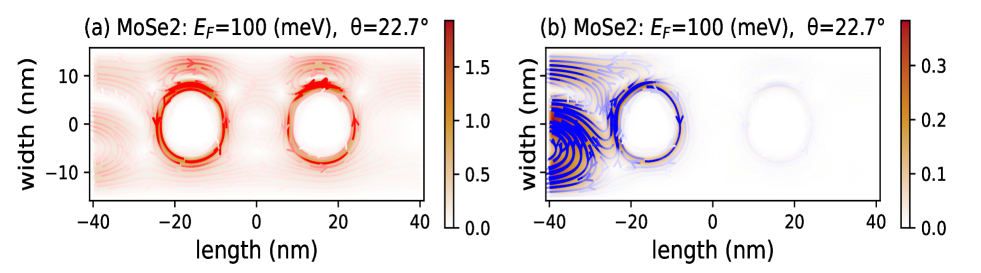
* **Subject Material:** MoSe2 (Molybdenum diselenide)
* **Common Parameters:**
* $E_F$ (Fermi Energy) = 100 (meV)
* $\theta$ (Angle) = 22.7°
* **Spatial Dimensions:**
* **X-axis (length):** Range from -40 nm to 40 nm.
* **Y-axis (width):** Range from -15 nm to 15 nm (labeled markers at -10, 0, 10).
---
## 2. Component Analysis: Plot (a)
### Header and Labels
* **Title:** (a) MoSe2: $E_F$=100 (meV), $\theta$=22.7°
* **X-axis Label:** length (nm)
* **Y-axis Label:** width (nm)
### Color Scale (Legend)
* **Location:** Right side of plot (a).
* **Type:** Sequential heatmap (White to Light Orange to Dark Red).
* **Range:** 0.0 to 1.5+ (Markers at 0.0, 0.5, 1.0, 1.5).
### Data Visualization and Trends
* **Heatmap Pattern:** Shows two distinct circular "hotspots" or rings of high intensity.
* **Ring 1 Center:** Approximately x = -18 nm, y = 0 nm.
* **Ring 2 Center:** Approximately x = +18 nm, y = 0 nm.
* **Intensity:** The highest intensity (dark red, ~1.5) is concentrated along the circumference of these two rings.
* **Streamlines:** Red vector lines with arrows indicate a clockwise flow around both circular structures. There is also a diffuse flow pattern on the far left (x = -40 to -30 nm).
---
## 3. Component Analysis: Plot (b)
### Header and Labels
* **Title:** (b) MoSe2: $E_F$=100 (meV), $\theta$=22.7°
* **X-axis Label:** length (nm)
* **Y-axis Label:** width (nm)
### Color Scale (Legend)
* **Location:** Right side of plot (b).
* **Type:** Sequential heatmap (White to Light Orange to Dark Red).
* **Range:** 0.0 to 0.3+ (Markers at 0.0, 0.1, 0.2, 0.3). Note the scale is significantly lower than plot (a).
### Data Visualization and Trends
* **Heatmap Pattern:**
* High intensity is concentrated on the far left edge (x = -40 nm) and around the first ring.
* The second ring (at x = +18 nm) shows almost zero intensity (white).
* **Streamlines:**
* **Color:** Blue vector lines.
* **Flow:** Complex turbulent/vortex-like flow on the left side (x = -40 to -25 nm).
* **Ring Interaction:** A strong clockwise circular flow is visible around the first ring (centered at x = -18 nm). Unlike plot (a), there is no significant flow or intensity around the second ring location.
* **Trend Verification:** The data series shows a rapid decay in intensity and flow magnitude as one moves from left to right across the length of the sample.
---
## 4. Comparative Summary Table
| Feature | Plot (a) | Plot (b) |
| :--- | :--- | :--- |
| **Max Intensity Value** | ~1.5+ | ~0.3+ |
| **Streamline Color** | Red | Blue |
| **Symmetry** | Roughly symmetric; both rings active. | Highly asymmetric; only left side/first ring active. |
| **Flow Direction** | Clockwise around both rings. | Clockwise around the first ring; turbulent on the left. |
| **Primary Focus** | Total field/density distribution. | Likely a specific component or current flow showing attenuation. |
## 5. Spatial Grounding and Coordinates
* **Origin [0,0]:** Located in the center of the length/width grid.
* **Ring 1 Radius:** Approximately 8 nm.
* **Ring 2 Radius:** Approximately 8 nm.
* **Legend Placement:** Both legends are vertically oriented on the right-hand side of their respective plots, spanning the full height of the y-axis.