## Line Chart: Gemma3-4b-it Layer1 Head Attention Weights
### Overview
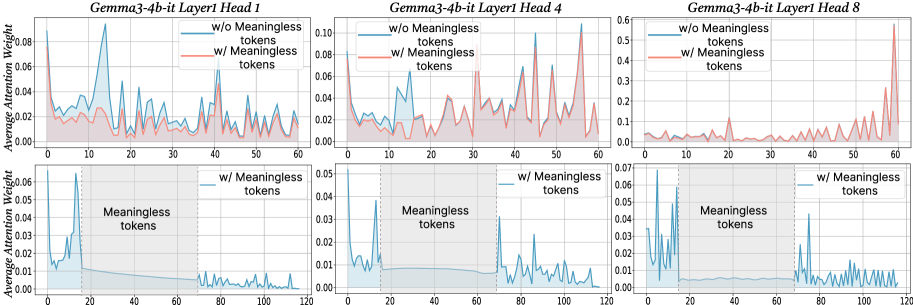
The image presents six line charts arranged in a 2x3 grid. Each chart displays the average attention weight of a language model (Gemma3-4b-it) for a specific layer (Layer1) and attention head (Head 1, Head 4, Head 8). The top row of charts shows attention weights for the first 60 tokens, comparing scenarios with and without "meaningless" tokens. The bottom row focuses on the attention weights "w/ Meaningless tokens" for the first 120 tokens, highlighting the region where these meaningless tokens occur.
### Components/Axes
**General Chart Elements:**
* **Titles:** Each chart has a title in the format "Gemma3-4b-it Layer1 Head [Number]".
* **X-axis:** Represents the token number. The top row charts range from 0 to 60, while the bottom row charts range from 0 to 120.
* **Y-axis:** Represents the "Average Attention Weight". The scale varies between charts.
* **Legend:** Located in the top-right corner of each of the top row charts.
* Blue line: "w/o Meaningless tokens"
* Red line: "w/ Meaningless tokens"
* **Shaded Region:** In the bottom row charts, a gray shaded region is labeled "Meaningless tokens". This region spans approximately from token 20 to token 70.
* **Vertical Dotted Line:** A vertical dotted line is present at approximately token 20 in the bottom row charts, marking the start of the "Meaningless tokens" region.
**Specific Axis Scales:**
* **Top-Left Chart (Head 1):** Y-axis ranges from 0.00 to 0.08.
* **Top-Middle Chart (Head 4):** Y-axis ranges from 0.00 to 0.10.
* **Top-Right Chart (Head 8):** Y-axis ranges from 0.0 to 0.6.
* **Bottom-Left Chart (Head 1):** Y-axis ranges from 0.00 to 0.06.
* **Bottom-Middle Chart (Head 4):** Y-axis ranges from 0.00 to 0.05.
* **Bottom-Right Chart (Head 8):** Y-axis ranges from 0.00 to 0.07.
### Detailed Analysis
**Top Row Charts (First 60 Tokens):**
* **Head 1:**
* **Blue line (w/o Meaningless tokens):** Fluctuates between 0.02 and 0.06.
* **Red line (w/ Meaningless tokens):** Generally lower than the blue line, fluctuating between 0.01 and 0.04.
* **Head 4:**
* **Blue line (w/o Meaningless tokens):** Fluctuates between 0.02 and 0.08, with a peak around token 15.
* **Red line (w/ Meaningless tokens):** Similar to the blue line, but slightly lower, fluctuating between 0.01 and 0.06.
* **Head 8:**
* **Blue line (w/o Meaningless tokens):** Relatively low and stable, mostly below 0.05.
* **Red line (w/ Meaningless tokens):** Shows a significant spike towards the end (around token 60), reaching approximately 0.55.
**Bottom Row Charts (First 120 Tokens, w/ Meaningless tokens):**
* **Head 1:** The blue line (w/ Meaningless tokens) shows a sharp initial peak around token 5, reaching approximately 0.06, then rapidly decreases and stabilizes around 0.01 within the "Meaningless tokens" region.
* **Head 4:** Similar to Head 1, the blue line (w/ Meaningless tokens) has a sharp initial peak around token 5, reaching approximately 0.05, then decreases and stabilizes around 0.01 within the "Meaningless tokens" region.
* **Head 8:** The blue line (w/ Meaningless tokens) shows a sharp initial peak around token 5, reaching approximately 0.06, then decreases and stabilizes around 0.005 within the "Meaningless tokens" region. There is a slight increase after token 70.
### Key Observations
* The presence of "meaningless tokens" generally reduces the average attention weight for Head 1 and Head 4 in the first 60 tokens.
* Head 8 exhibits a significant spike in attention weight towards the end of the first 60 tokens *only* when "meaningless tokens" are included.
* In the bottom row charts, all heads show a sharp initial peak in attention weight, followed by a decrease and stabilization within the "Meaningless tokens" region.
* The Y-axis scale for Head 8 is significantly larger than for Head 1 and Head 4, indicating that Head 8 can have much higher attention weights.
### Interpretation
The charts illustrate how the inclusion of "meaningless tokens" affects the attention weights of different heads in the Gemma3-4b-it language model. The initial spike in attention weight in the bottom row charts suggests that the model initially focuses on these tokens. However, within the "Meaningless tokens" region, the attention weights stabilize at a lower level, indicating that the model learns to disregard these tokens to some extent. The spike in Head 8's attention weight at the end of the first 60 tokens when "meaningless tokens" are present suggests that this head might be compensating for the presence of these tokens by focusing on other parts of the input sequence. The differences in attention patterns across different heads highlight the diverse roles that each head plays in the model's attention mechanism.