\n
## Diagram: State Transition with Planning, Update, and Verification
### Overview
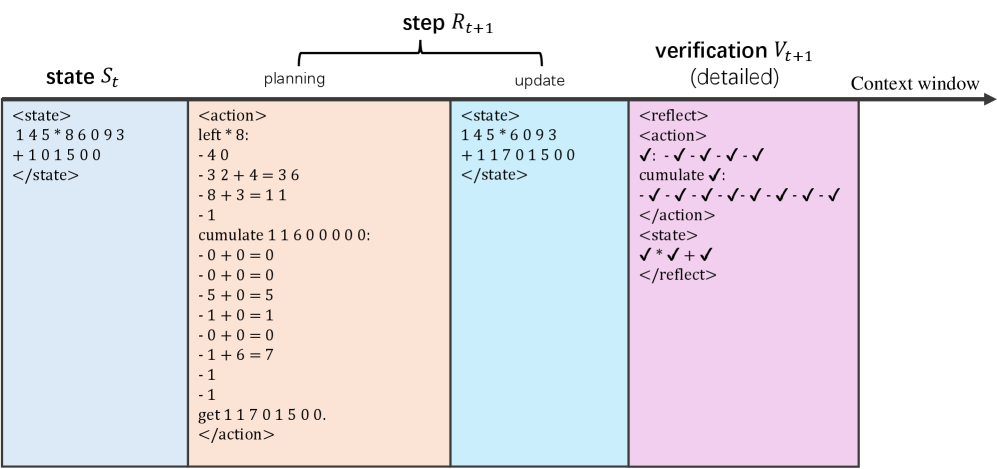
The image depicts a diagram illustrating a state transition process, broken down into four columns: `state St`, `planning`, `update`, and `verification Vt+1`, with a final column labeled `Context window`. Each column represents a stage in a sequential process, likely within a reinforcement learning or similar iterative system. The diagram uses XML-like tags to denote state and action elements.
### Components/Axes
The diagram is structured into four main columns, visually separated by colored backgrounds:
* **State St (Blue):** Represents the current state of the system.
* **Planning (Peach):** Shows the actions planned to transition to the next state.
* **Update (Light Blue):** Displays the updated state after applying the planned actions.
* **Verification Vt+1 (Pink):** Indicates the verification of the updated state.
* **Context Window (Grey):** A final column indicating the context window.
The top of the diagram has a label: `step Rt+1`.
### Detailed Analysis or Content Details
**1. State St (Blue Column)**
* `<state>` tag:
* `145 * 86093`
* `+101500`
* `</state>`
**2. Planning (Peach Column)**
* `<action>` tag:
* `left * 8:`
* `-40`
* `-32 + 4 = 36`
* `-8 + 3 = 11`
* `-1`
* `cumulate 11600000:`
* `-0 + 0 = 0`
* `-0 + 0 = 0`
* `-5 + 0 = 5`
* `-1 + 0 = 1`
* `-0 + 0 = 0`
* `-1 + 6 = 7`
* `-1`
* `-1`
* `get 11701500.`
* `</action>`
**3. Update (Light Blue Column)**
* `<state>` tag:
* `145 * 6093`
* `+11701500`
* `</state>`
**4. Verification Vt+1 (Pink Column)**
* `<reflect>` tag:
* `√ · √ · √ · √`
* `cumulate √:`
* `· √ · √ · √ · √ · √`
* `</action>`
* `<state>` tag:
* `√ √ √ √`
* `</reflect>`
**5. Context Window (Grey Column)**
* This column is empty.
### Key Observations
* The `planning` column contains a series of arithmetic operations and a cumulative calculation.
* The `update` column shows a modified state based on the planning stage.
* The `verification` column uses checkmarks (√) and dots (·) to indicate verification status, potentially representing successful or failed checks.
* The `cumulate` operation appears in both the `planning` and `verification` stages.
* The values within the `<state>` tags change between the initial state and the updated state.
### Interpretation
This diagram likely represents a step in a reinforcement learning or control system. The `state` represents the system's current condition. The `planning` stage calculates actions to take based on the current state. The `update` stage applies these actions, resulting in a new state. Finally, the `verification` stage checks the validity or correctness of the updated state. The use of checkmarks and dots suggests a binary verification process. The `Context window` may represent the information available to the system during this step.
The arithmetic operations in the `planning` stage suggest a calculation of rewards or penalties associated with different actions. The `cumulate` operation likely accumulates these rewards or penalties over time. The change in the state values between the `state` and `update` columns indicates that the actions taken in the `planning` stage have modified the system's state. The diagram provides a high-level overview of a state transition process, focusing on the planning, update, and verification stages.