## Line Charts: I-Don't-Know Rate vs. Layer for Llama-3.2-1B and Llama-3.2-3B
### Overview
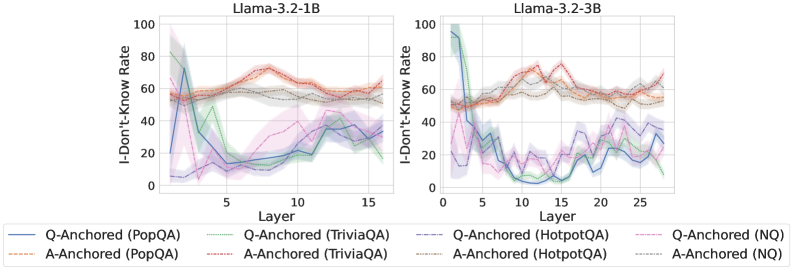
The image presents two line charts comparing the "I-Don't-Know Rate" across different layers of two language models, Llama-3.2-1B and Llama-3.2-3B. Each chart displays six data series, representing different question-answering datasets (PopQA, TriviaQA, HotpotQA, and NQ) anchored by either the question (Q-Anchored) or the answer (A-Anchored). The x-axis represents the layer number, and the y-axis represents the I-Don't-Know Rate in percentage.
### Components/Axes
* **Chart Titles:**
* Left Chart: "Llama-3.2-1B"
* Right Chart: "Llama-3.2-3B"
* **Y-Axis:**
* Label: "I-Don't-Know Rate"
* Scale: 0 to 100, with tick marks at 0, 20, 40, 60, 80, and 100.
* **X-Axis:**
* Label: "Layer"
* Left Chart Scale: 0 to 15, with tick marks at 0, 5, 10, and 15.
* Right Chart Scale: 0 to 25, with tick marks at 0, 5, 10, 15, 20, and 25.
* **Legend:** Located at the bottom of the image, describing the data series:
* Blue solid line: "Q-Anchored (PopQA)"
* Brown dashed line: "A-Anchored (PopQA)"
* Green dotted line: "Q-Anchored (TriviaQA)"
* Green dashed-dotted line: "A-Anchored (TriviaQA)"
* Red dashed-dotted line: "Q-Anchored (HotpotQA)"
* Black dotted line: "A-Anchored (NQ)"
* Purple dashed line: "Q-Anchored (NQ)"
* Purple dashed-dotted line: "A-Anchored (HotpotQA)"
### Detailed Analysis
#### Llama-3.2-1B (Left Chart)
* **Q-Anchored (PopQA) (Blue solid line):** Starts high (around 60-80), drops sharply to approximately 10-20 by layer 5, then gradually increases to around 20-30 by layer 15.
* **A-Anchored (PopQA) (Brown dashed line):** Relatively stable, fluctuating between 55 and 70 across all layers.
* **Q-Anchored (TriviaQA) (Green dotted line):** Starts around 60, drops to approximately 20-30 by layer 5, then fluctuates between 20 and 40.
* **A-Anchored (TriviaQA) (Green dashed-dotted line):** Starts around 50, drops to approximately 20-30 by layer 5, then fluctuates between 20 and 40.
* **Q-Anchored (HotpotQA) (Red dashed-dotted line):** Relatively stable, fluctuating between 60 and 75 across all layers.
* **A-Anchored (NQ) (Black dotted line):** Relatively stable, fluctuating between 55 and 70 across all layers.
* **Q-Anchored (NQ) (Purple dashed line):** Starts low (around 5-10), increases to approximately 40-50 by layer 10, then decreases to around 30-40 by layer 15.
* **A-Anchored (HotpotQA) (Purple dashed-dotted line):** Starts low (around 5-10), increases to approximately 40-50 by layer 10, then decreases to around 30-40 by layer 15.
#### Llama-3.2-3B (Right Chart)
* **Q-Anchored (PopQA) (Blue solid line):** Starts very high (near 100), drops sharply to near 0 by layer 5, then remains low (around 0-10) for the remaining layers.
* **A-Anchored (PopQA) (Brown dashed line):** Relatively stable, fluctuating between 50 and 75 across all layers.
* **Q-Anchored (TriviaQA) (Green dotted line):** Starts high (around 60), drops to approximately 5-15 by layer 5, then fluctuates between 5 and 25.
* **A-Anchored (TriviaQA) (Green dashed-dotted line):** Starts around 50, drops to approximately 10-20 by layer 5, then fluctuates between 10 and 30.
* **Q-Anchored (HotpotQA) (Red dashed-dotted line):** Relatively stable, fluctuating between 50 and 75 across all layers.
* **A-Anchored (NQ) (Black dotted line):** Relatively stable, fluctuating between 50 and 70 across all layers.
* **Q-Anchored (NQ) (Purple dashed line):** Starts low (around 10-20), increases to approximately 30-40 by layer 10, then decreases to around 10-20 by layer 25.
* **A-Anchored (HotpotQA) (Purple dashed-dotted line):** Starts low (around 10-20), increases to approximately 30-40 by layer 10, then decreases to around 10-20 by layer 25.
### Key Observations
* For both models, the "I-Don't-Know Rate" for Q-Anchored (PopQA) and Q-Anchored (TriviaQA) decreases significantly in the initial layers.
* The A-Anchored series (PopQA, TriviaQA, and NQ) tend to be more stable across layers compared to their Q-Anchored counterparts.
* The Llama-3.2-3B model shows a more pronounced drop in the "I-Don't-Know Rate" for Q-Anchored (PopQA) compared to Llama-3.2-1B.
* The Q-Anchored (NQ) and A-Anchored (HotpotQA) series exhibit a similar trend of increasing and then decreasing "I-Don't-Know Rate" across layers.
### Interpretation
The charts suggest that the initial layers of the language models play a crucial role in determining whether the model "knows" the answer to a question, especially when the question is directly anchored. The significant drop in the "I-Don't-Know Rate" for Q-Anchored (PopQA) and Q-Anchored (TriviaQA) in the early layers indicates that these layers are responsible for extracting relevant information from the question. The stability of the A-Anchored series implies that the model's confidence in its answer is less affected by the specific layer once the answer is anchored. The difference in the magnitude of the drop between Llama-3.2-1B and Llama-3.2-3B for Q-Anchored (PopQA) may indicate that the larger model (3B) is more effective at extracting information from the question in the initial layers. The similar trends observed for Q-Anchored (NQ) and A-Anchored (HotpotQA) suggest a potential relationship between these datasets in terms of how the model processes them across different layers.