## Diagram & Chart: Reinforcement Learning Environment & Reward Curve
### Overview
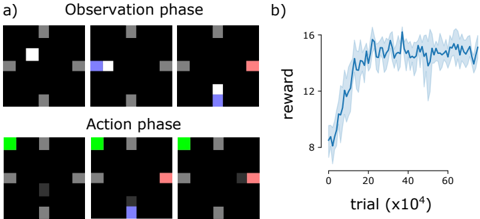
The image presents a reinforcement learning environment visualized as a grid world, alongside a chart showing the reward received over training trials. The grid world is shown in two phases: Observation and Action. The chart displays the average reward as a function of the trial number.
### Components/Axes
**Diagram (a):**
* **Title:** "Observation phase" and "Action phase"
* **Grid:** A 6x6 grid with cells colored black, gray, white, blue, green, and red.
* **Agent Representation:** White (Observation), Blue (Observation), Green (Action), Red (Action).
* **Grid Cell States:** Black (empty), Gray (obstacle).
**Chart (b):**
* **Title:** None explicitly stated, but implied to be "Reward vs. Trial"
* **X-axis:** "trial (x10⁴)" - ranging from approximately 0 to 60 (in units of 10,000 trials).
* **Y-axis:** "reward" - ranging from approximately 6 to 16.
* **Data Series:** A single blue line representing the average reward, with a shaded region indicating the standard deviation or confidence interval.
### Detailed Analysis or Content Details
**Diagram (a): Observation Phase (Top Row)**
The observation phase shows the agent (represented by white and blue squares) navigating a grid with obstacles (gray squares). The sequence of states is as follows:
1. White square in the top-left corner.
2. Blue square moves one cell to the right.
3. Blue square moves one cell down.
4. Blue square moves one cell down, and a red square appears in the bottom-right corner.
**Diagram (a): Action Phase (Bottom Row)**
The action phase shows the agent (represented by green and red squares) taking actions in the same grid. The sequence of states is as follows:
1. Green square in the top-left corner.
2. Green square remains in the same position.
3. Red square moves one cell up.
4. Red square moves one cell up, and a blue square appears in the bottom-left corner.
**Chart (b): Reward Curve**
The reward curve shows a clear learning trend.
* **Initial Phase (0-20 x10⁴ trials):** The reward increases rapidly from approximately 7 to 14.
* **Plateau Phase (20-40 x10⁴ trials):** The reward plateaus around 15, with fluctuations.
* **Decline Phase (40-60 x10⁴ trials):** The reward decreases from approximately 15 to 12, with fluctuations.
Approximate data points (reading from the chart):
* Trial 0 x10⁴: Reward ≈ 7
* Trial 10 x10⁴: Reward ≈ 12
* Trial 20 x10⁴: Reward ≈ 14
* Trial 30 x10⁴: Reward ≈ 15
* Trial 40 x10⁴: Reward ≈ 15
* Trial 50 x10⁴: Reward ≈ 13
* Trial 60 x10⁴: Reward ≈ 12
### Key Observations
* The agent appears to observe its environment and then take actions based on that observation.
* The reward curve indicates successful learning initially, followed by a period of stabilization and then a slight decline in performance.
* The shaded region in the chart suggests variability in the reward obtained across different trials.
### Interpretation
The image demonstrates a reinforcement learning setup where an agent learns to navigate a grid world. The observation phase allows the agent to perceive its environment, while the action phase allows it to interact with it. The reward curve shows that the agent initially learns to maximize its reward, but its performance may degrade over time, potentially due to overfitting or changes in the environment. The decline in reward after 40 x10⁴ trials could indicate the need for further exploration or adjustments to the learning algorithm. The grid world setup is a simplified representation of a more complex environment, but it provides a useful framework for understanding the principles of reinforcement learning. The color coding of the grid cells (white, blue, green, red, gray, black) likely represents different states or features of the environment, such as the agent's position, obstacles, or goal locations.