\n
## Scatter Plot: Top-1 Accuracy vs. Joules
### Overview
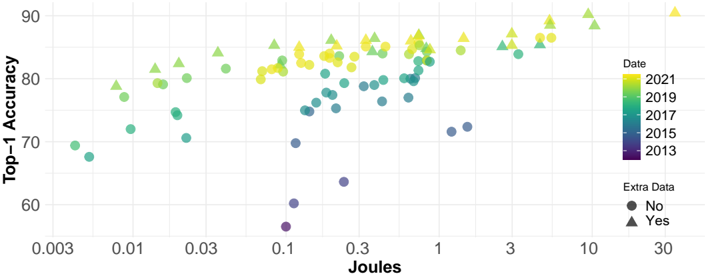
This image presents a scatter plot visualizing the relationship between Joules and Top-1 Accuracy, with data points colored by Date and shaped by whether or not Extra Data was used. The plot appears to demonstrate how accuracy improves with increasing Joules, and how this relationship changes over time.
### Components/Axes
* **X-axis:** Joules, ranging from approximately 0.003 to 30. The scale is logarithmic, with markers at 0.003, 0.01, 0.03, 0.1, 0.3, 1, 3, and 10.
* **Y-axis:** Top-1 Accuracy, ranging from approximately 60 to 90. The scale is linear, with markers at 60, 70, 80, and 90.
* **Legend 1 (Top-Right):** Date, with the following color mapping:
* 2021: Yellow (#FFDA63)
* 2019: Light Green (#98FF98)
* 2017: Green (#32CD32)
* 2015: Cyan (#00FFFF)
* 2013: Purple (#8A2BE2)
* **Legend 2 (Bottom-Right):** Extra Data, with the following shape mapping:
* No: Circle (Blue)
* Yes: Triangle (Green)
### Detailed Analysis
The plot contains numerous data points, each representing a specific experiment or configuration. The data can be analyzed by considering both the Date and Extra Data dimensions.
**Data Trends by Date:**
* **2013 (Purple):** Data points are clustered towards the lower left of the plot, indicating low Joules and low Top-1 Accuracy. Accuracy ranges from approximately 60 to 75, with Joules ranging from 0.003 to 0.3.
* **2015 (Cyan):** Data points show a slight improvement in accuracy compared to 2013, with accuracy ranging from approximately 65 to 80 and Joules ranging from 0.01 to 1.
* **2017 (Green):** Data points continue to show improvement, with accuracy ranging from approximately 70 to 85 and Joules ranging from 0.03 to 3.
* **2019 (Light Green):** Data points show further improvement, with accuracy ranging from approximately 75 to 90 and Joules ranging from 0.1 to 10.
* **2021 (Yellow):** Data points are generally clustered towards the upper right of the plot, indicating high Joules and high Top-1 Accuracy. Accuracy ranges from approximately 80 to 90, with Joules ranging from 0.3 to 30.
**Data Trends by Extra Data:**
* **No (Circles - Blue):** The majority of data points fall within this category. The trend shows that as Joules increase, Top-1 Accuracy generally increases. There are some outliers, particularly at higher Joules values (around 1-3), where accuracy plateaus or even slightly decreases.
* **Yes (Triangles - Green):** Data points in this category generally exhibit higher Top-1 Accuracy for a given Joules value compared to the "No" category. The trend is similar, with accuracy increasing with Joules, but the improvement is more pronounced.
**Specific Data Points (Approximate):**
* (0.003, 65) - Purple Circle (2013, No Extra Data)
* (0.01, 75) - Green Triangle (2017, Yes Extra Data)
* (0.1, 70) - Cyan Circle (2015, No Extra Data)
* (0.3, 80) - Light Green Triangle (2019, Yes Extra Data)
* (1, 85) - Yellow Circle (2021, No Extra Data)
* (3, 88) - Yellow Triangle (2021, Yes Extra Data)
* (10, 89) - Yellow Triangle (2021, Yes Extra Data)
* (30, 87) - Yellow Circle (2021, No Extra Data)
### Key Observations
* There is a clear positive correlation between Joules and Top-1 Accuracy.
* The use of Extra Data generally leads to higher Top-1 Accuracy for a given Joules value.
* Accuracy has improved significantly over time (from 2013 to 2021).
* The rate of accuracy improvement appears to be slowing down in recent years (2019-2021).
* There are some outliers, suggesting that other factors besides Joules and Extra Data may influence Top-1 Accuracy.
### Interpretation
The data suggests that increasing computational resources (represented by Joules) generally leads to improved model accuracy. The consistent improvement in accuracy over time likely reflects advancements in model architecture, training techniques, and data quality. The benefit of using "Extra Data" indicates that more comprehensive datasets can further enhance model performance. The plateauing of accuracy at higher Joules values suggests diminishing returns – at some point, increasing computational resources yields only marginal improvements. This could be due to limitations in the model architecture or the inherent complexity of the task. The outliers suggest that other variables, not captured in this visualization, play a role in determining model accuracy. Further investigation could explore the impact of these additional factors. The logarithmic scale on the x-axis indicates that the relationship between Joules and accuracy is not linear, and that the initial increase in Joules has a more significant impact on accuracy than subsequent increases.