\n
## Scatter Plot: Confidence vs. Target Length
### Overview
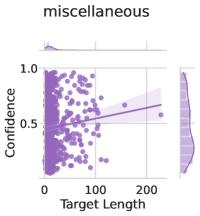
The image presents a scatter plot visualizing the relationship between "Target Length" and "Confidence". A regression line with a confidence interval is overlaid on the scatter points. Marginal histograms are displayed above and to the right of the main plot, showing the distributions of "Target Length" and "Confidence" respectively. The plot is titled "miscellaneous".
### Components/Axes
* **X-axis:** "Target Length" - Scale ranges from approximately 0 to 220.
* **Y-axis:** "Confidence" - Scale ranges from approximately 0.3 to 1.0.
* **Scatter Points:** Numerous purple dots representing individual data points.
* **Regression Line:** A purple line representing the trend of the data.
* **Confidence Interval:** A shaded purple area around the regression line, indicating the uncertainty in the estimated trend.
* **Top Histogram:** Displays the distribution of "Target Length". The x-axis is "Target Length" and the y-axis represents density.
* **Right Histogram:** Displays the distribution of "Confidence". The y-axis is "Density" and the x-axis represents "Confidence".
### Detailed Analysis
The scatter plot shows a generally positive, but weak, correlation between "Target Length" and "Confidence".
* **Trend:** The regression line slopes upward, indicating that as "Target Length" increases, "Confidence" tends to increase, but the relationship is not strong.
* **Data Points:**
* At "Target Length" = 0, "Confidence" values range from approximately 0.35 to 0.95.
* At "Target Length" = 50, "Confidence" values range from approximately 0.4 to 0.9.
* At "Target Length" = 100, "Confidence" values range from approximately 0.4 to 0.8.
* At "Target Length" = 150, "Confidence" values range from approximately 0.4 to 0.7.
* At "Target Length" = 200, "Confidence" values range from approximately 0.4 to 0.6.
* **Top Histogram:** The distribution of "Target Length" is heavily skewed towards lower values, with a peak around 0-20 and a long tail extending to approximately 220.
* **Right Histogram:** The distribution of "Confidence" is somewhat skewed towards higher values, with a peak around 0.7-0.8 and a tail extending down to approximately 0.3.
### Key Observations
* The scatter plot shows a weak positive correlation.
* The confidence interval around the regression line is relatively wide, indicating substantial uncertainty in the estimated relationship.
* The distribution of "Target Length" is highly skewed, which may influence the observed correlation.
* There is a cluster of points with low "Target Length" and high "Confidence".
### Interpretation
The data suggests that there is a slight tendency for "Confidence" to increase with "Target Length", but this relationship is weak and may be influenced by other factors. The wide confidence interval indicates that the observed trend may not be statistically significant. The skewed distribution of "Target Length" could be contributing to the weak correlation, as most data points are concentrated at lower values. The cluster of points with low "Target Length" and high "Confidence" could represent a specific scenario where confidence is high even when the target length is small. The title "miscellaneous" suggests this data may be from a broader exploratory analysis and not a focused investigation. The marginal histograms provide additional context about the distributions of the individual variables, which can help to understand the overall pattern in the scatter plot.