\n
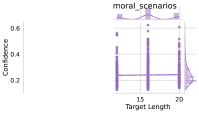
## Box Plot: Confidence vs. Target Length for Moral Scenarios
### Overview
The image presents a box plot visualizing the relationship between "Target Length" and "Confidence" for a dataset labeled "moral_scenarios". The plot displays the distribution of confidence values for two different target lengths: approximately 15 and 20.
### Components/Axes
* **X-axis:** "Target Length" with markers at 15 and 20.
* **Y-axis:** "Confidence" ranging from approximately 0.1 to 0.6.
* **Title:** "moral_scenarios" positioned at the top-center of the plot.
* **Data Series:** Two box plots, one centered around Target Length 15 and the other around Target Length 20.
* **Color:** The box plots are rendered in a purple hue.
### Detailed Analysis
The box plot for Target Length 15 shows:
* **Minimum Confidence:** Approximately 0.18
* **First Quartile (Q1):** Approximately 0.25
* **Median (Q2):** Approximately 0.32
* **Third Quartile (Q3):** Approximately 0.38
* **Maximum Confidence:** Approximately 0.52
* **Outliers:** Several data points are plotted as individual dots above the maximum confidence value, ranging from approximately 0.53 to 0.58.
The box plot for Target Length 20 shows:
* **Minimum Confidence:** Approximately 0.18
* **First Quartile (Q1):** Approximately 0.25
* **Median (Q2):** Approximately 0.35
* **Third Quartile (Q3):** Approximately 0.42
* **Maximum Confidence:** Approximately 0.48
* **Outliers:** Several data points are plotted as individual dots above the maximum confidence value, ranging from approximately 0.49 to 0.59.
The distributions appear similar, but the Target Length 20 box plot seems to be slightly shifted towards higher confidence values.
### Key Observations
* Both target lengths exhibit a similar range of confidence values.
* The median confidence is slightly higher for Target Length 20 (approximately 0.35) compared to Target Length 15 (approximately 0.32).
* Both distributions contain outliers, suggesting some instances of unusually high confidence.
* The interquartile range (IQR) appears to be slightly wider for Target Length 20, indicating greater variability in confidence scores.
### Interpretation
The data suggests that there is a slight positive correlation between target length and confidence in the "moral_scenarios" dataset. Increasing the target length from 15 to 20 appears to result in a modest increase in the median confidence score. However, the overlap in the distributions indicates that target length is not a strong predictor of confidence. The presence of outliers in both groups suggests that other factors may significantly influence confidence levels in certain scenarios. The box plots provide a concise visual summary of the distribution of confidence scores for each target length, highlighting the central tendency, spread, and potential outliers. Further investigation would be needed to determine the underlying reasons for the observed differences and the factors contributing to the outliers.