\n
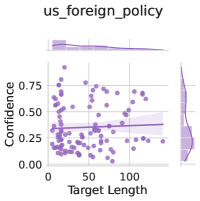
## Scatter Plot: US Foreign Policy Confidence vs. Target Length
### Overview
The image presents a scatter plot visualizing the relationship between "Target Length" and "Confidence" related to "us_foreign_policy". The plot includes a regression line with a shaded confidence interval, and a density plot on the right side. The data points are scattered, suggesting a complex relationship.
### Components/Axes
* **Title:** "us_foreign_policy" (top-center)
* **X-axis:** "Target Length" (bottom-center), ranging from approximately 0 to 120.
* **Y-axis:** "Confidence" (left-center), ranging from 0.00 to 0.75.
* **Data Points:** Numerous purple dots scattered across the plot.
* **Regression Line:** A purple line attempting to model the trend of the data. It slopes slightly downward.
* **Confidence Interval:** A shaded purple area around the regression line, indicating the uncertainty in the line's estimate.
* **Density Plot:** A purple density plot on the right side of the chart, showing the distribution of confidence values.
### Detailed Analysis
The scatter plot shows a generally dispersed pattern of data points.
* **Regression Line Trend:** The regression line exhibits a slight negative slope, indicating that as "Target Length" increases, "Confidence" tends to decrease, but the relationship is weak.
* **Data Point Distribution:**
* For "Target Length" values between 0 and 20, "Confidence" values are generally low, ranging from approximately 0.05 to 0.30.
* Between 20 and 50, "Confidence" values increase, with a cluster of points between 0.30 and 0.60.
* From 50 to 120, "Confidence" values are more scattered, ranging from approximately 0.10 to 0.70, with a tendency to decrease slightly.
* **Density Plot:** The density plot on the right shows a peak in the distribution of "Confidence" values around 0.25-0.35, with a long tail extending towards higher confidence values.
### Key Observations
* The relationship between "Target Length" and "Confidence" is weak and not strongly linear.
* There is a significant amount of variability in "Confidence" for a given "Target Length".
* The density plot suggests that lower confidence levels are more common.
* There are no obvious outliers.
### Interpretation
The data suggests that the length of the target (whatever that refers to in the context of US foreign policy) has a limited impact on the confidence level. The weak negative trend in the regression line implies that longer targets might be associated with slightly lower confidence, but this relationship is not strong. The wide confidence interval around the regression line indicates substantial uncertainty in this estimate. The density plot reinforces the idea that confidence levels are generally low, with a concentration of values around 0.25-0.35.
The plot likely represents an analysis of some model's predictions or human assessments related to US foreign policy. "Target Length" could refer to the length of a policy document, the duration of a foreign policy initiative, or some other relevant metric. The "Confidence" score likely represents the certainty or reliability of a prediction or assessment. The data suggests that the model or assessment process is not highly confident in its predictions, and that the length of the target is not a strong predictor of confidence.