## Bar Chart: Prediction Flip Rate Comparison for Different Models
### Overview
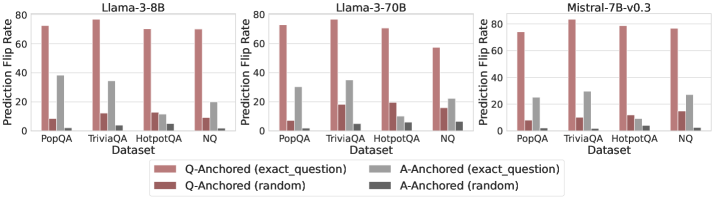
The image presents three bar charts comparing the prediction flip rates of different language models (Llama-3-8B, Llama-3-70B, and Mistral-7B-v0.3) across four datasets (PopQA, TriviaQA, HotpotQA, and NQ). The charts show the prediction flip rates for question-anchored and answer-anchored methods, both with exact questions and random questions.
### Components/Axes
* **Title:** Each chart has a title indicating the language model being evaluated: "Llama-3-8B", "Llama-3-70B", and "Mistral-7B-v0.3".
* **Y-axis:** "Prediction Flip Rate" ranging from 0 to 80.
* **X-axis:** "Dataset" with four categories: "PopQA", "TriviaQA", "HotpotQA", and "NQ".
* **Legend:** Located at the bottom of the image.
* Light Red: "Q-Anchored (exact\_question)"
* Dark Red: "Q-Anchored (random)"
* Light Gray: "A-Anchored (exact\_question)"
* Dark Gray: "A-Anchored (random)"
### Detailed Analysis
**Llama-3-8B**
* **PopQA:**
* Q-Anchored (exact\_question): ~73
* Q-Anchored (random): ~8
* A-Anchored (exact\_question): ~38
* A-Anchored (random): ~23
* **TriviaQA:**
* Q-Anchored (exact\_question): ~73
* Q-Anchored (random): ~12
* A-Anchored (exact\_question): ~34
* A-Anchored (random): ~3
* **HotpotQA:**
* Q-Anchored (exact\_question): ~72
* Q-Anchored (random): ~12
* A-Anchored (exact\_question): ~10
* A-Anchored (random): ~3
* **NQ:**
* Q-Anchored (exact\_question): ~72
* Q-Anchored (random): ~12
* A-Anchored (exact\_question): ~20
* A-Anchored (random): ~3
**Llama-3-70B**
* **PopQA:**
* Q-Anchored (exact\_question): ~75
* Q-Anchored (random): ~8
* A-Anchored (exact\_question): ~30
* A-Anchored (random): ~8
* **TriviaQA:**
* Q-Anchored (exact\_question): ~75
* Q-Anchored (random): ~18
* A-Anchored (exact\_question): ~48
* A-Anchored (random): ~15
* **HotpotQA:**
* Q-Anchored (exact\_question): ~80
* Q-Anchored (random): ~25
* A-Anchored (exact\_question): ~20
* A-Anchored (random): ~5
* **NQ:**
* Q-Anchored (exact\_question): ~72
* Q-Anchored (random): ~18
* A-Anchored (exact\_question): ~30
* A-Anchored (random): ~15
**Mistral-7B-v0.3**
* **PopQA:**
* Q-Anchored (exact\_question): ~75
* Q-Anchored (random): ~10
* A-Anchored (exact\_question): ~28
* A-Anchored (random): ~10
* **TriviaQA:**
* Q-Anchored (exact\_question): ~75
* Q-Anchored (random): ~12
* A-Anchored (exact\_question): ~30
* A-Anchored (random): ~5
* **HotpotQA:**
* Q-Anchored (exact\_question): ~73
* Q-Anchored (random): ~10
* A-Anchored (exact\_question): ~10
* A-Anchored (random): ~2
* **NQ:**
* Q-Anchored (exact\_question): ~73
* Q-Anchored (random): ~10
* A-Anchored (exact\_question): ~15
* A-Anchored (random): ~2
### Key Observations
* **Q-Anchored (exact\_question)** consistently shows the highest prediction flip rate across all datasets and models.
* **Q-Anchored (random)** consistently shows a low prediction flip rate across all datasets and models.
* **A-Anchored (exact\_question)** and **A-Anchored (random)** show varying prediction flip rates depending on the dataset and model, generally lower than Q-Anchored (exact\_question).
* Llama-3-70B shows a higher A-Anchored (exact\_question) prediction flip rate for TriviaQA compared to the other models.
* The prediction flip rates for Q-Anchored (exact\_question) are relatively consistent across all datasets for each model.
### Interpretation
The data suggests that using the exact question as an anchor (Q-Anchored (exact\_question)) leads to a significantly higher prediction flip rate compared to using a random question. This indicates that the models are highly sensitive to the specific wording of the question. The lower flip rates for A-Anchored methods suggest that the models are less sensitive to the answer context. The differences between the models highlight variations in their robustness and sensitivity to question phrasing across different datasets. The consistency of Q-Anchored (exact\_question) across datasets suggests a general vulnerability to specific question formulations, regardless of the knowledge domain.