## Histogram: Question vs. Answer Token Count Distribution
### Overview
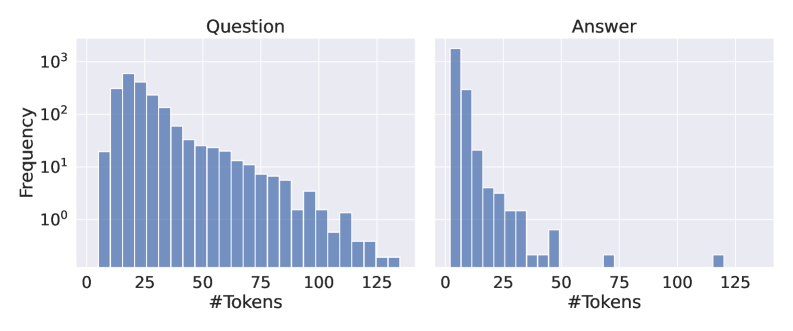
The image presents two histograms side-by-side, comparing the frequency distribution of token counts for "Question" and "Answer" texts. The x-axis represents the number of tokens, while the y-axis represents the frequency on a logarithmic scale.
### Components/Axes
* **Titles:** "Question" (left histogram), "Answer" (right histogram)
* **X-axis:** "#Tokens" (both histograms), ranging from 0 to 125 in increments of approximately 25.
* **Y-axis:** "Frequency" (both histograms), using a logarithmic scale with markers at 10<sup>0</sup> (1), 10<sup>1</sup> (10), 10<sup>2</sup> (100), and 10<sup>3</sup> (1000).
* **Bars:** The histograms are composed of vertical bars, each representing the frequency of a specific token count range. The bars are a uniform light blue-gray color.
### Detailed Analysis
**Question Histogram:**
* **Trend:** The frequency of questions decreases as the number of tokens increases. The distribution is right-skewed.
* **Data Points (Approximate):**
* Around 10 tokens: Frequency ~ 600
* Around 25 tokens: Frequency ~ 250
* Around 50 tokens: Frequency ~ 50
* Around 75 tokens: Frequency ~ 15
* Around 100 tokens: Frequency ~ 5
* Around 125 tokens: Frequency ~ 2
**Answer Histogram:**
* **Trend:** The frequency of answers is heavily concentrated at low token counts, with a rapid decrease as the number of tokens increases. The distribution is strongly right-skewed.
* **Data Points (Approximate):**
* Around 10 tokens: Frequency ~ 1200
* Around 25 tokens: Frequency ~ 50
* Around 50 tokens: Frequency ~ 5
* Around 75 tokens: Frequency ~ 1
* Around 100 tokens: Frequency ~ 0
* Around 125 tokens: Frequency ~ 1
### Key Observations
* The "Answer" histogram shows a much higher frequency of very short texts compared to the "Question" histogram.
* Both histograms exhibit a right-skewed distribution, indicating that longer texts are less frequent.
* The "Question" histogram has a more gradual decline in frequency as token count increases, suggesting a wider range of question lengths.
### Interpretation
The histograms suggest that answers tend to be shorter than questions, as indicated by the higher frequency of low token counts in the "Answer" histogram. The right-skewed distributions in both histograms reflect the natural tendency for shorter texts to be more common than longer texts. The difference in the shape of the distributions indicates that questions have a more diverse range of lengths compared to answers. This could be due to the nature of questions requiring more context or detail, while answers can often be concise.