## Bar Chart: CoC (try Python except LM state)
### Overview
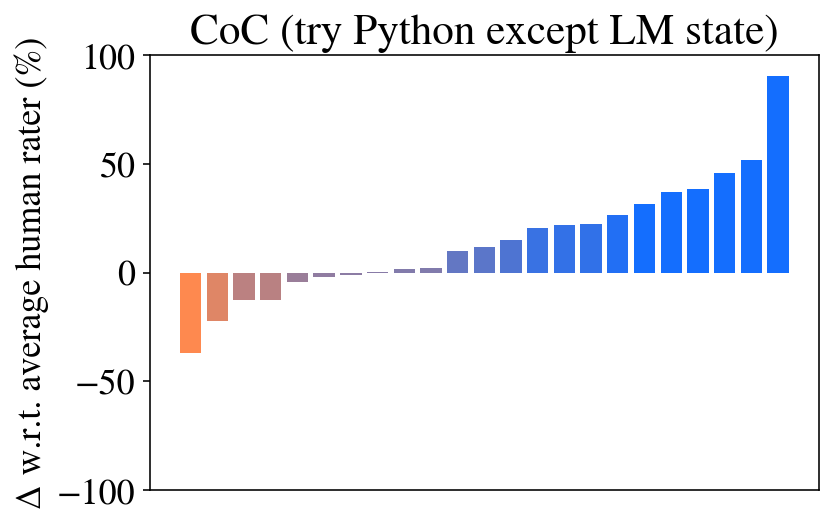
The image is a bar chart displaying the change in performance relative to the average human rater for different configurations of a system, likely related to code generation or evaluation. The x-axis represents different configurations, and the y-axis represents the delta (Δ) with respect to the average human rater in percentage. The bars are colored in a gradient from orange to blue, indicating a spectrum of performance changes, from negative to positive.
### Components/Axes
* **Title:** CoC (try Python except LM state)
* **Y-axis Label:** Δ w.r.t. average human rater (%)
* **Y-axis Scale:** -100, -50, 0, 50, 100
* **X-axis:** Implicitly represents different configurations, but is not explicitly labeled.
* **Colors:** The bars are colored in a gradient from orange to blue, indicating a spectrum of performance changes, from negative to positive.
### Detailed Analysis
The chart presents a series of bars, each representing a different configuration. The bars are arranged in ascending order of performance change relative to the average human rater.
* **Negative Changes:** The first few bars on the left side of the chart are orange and represent configurations that perform worse than the average human rater.
* The first bar has a value of approximately -40%.
* The second bar has a value of approximately -20%.
* The third bar has a value of approximately -15%.
* The fourth bar has a value of approximately -10%.
* The fifth bar has a value of approximately -5%.
* **Near Zero Changes:** There are a few bars near the center that are close to zero, indicating performance similar to the average human rater.
* The sixth bar has a value of approximately -2%.
* The seventh bar has a value of approximately 0%.
* The eighth bar has a value of approximately 1%.
* **Positive Changes:** The bars on the right side of the chart are blue and represent configurations that perform better than the average human rater.
* The ninth bar has a value of approximately 5%.
* The tenth bar has a value of approximately 10%.
* The eleventh bar has a value of approximately 12%.
* The twelfth bar has a value of approximately 15%.
* The thirteenth bar has a value of approximately 20%.
* The fourteenth bar has a value of approximately 25%.
* The fifteenth bar has a value of approximately 35%.
* The sixteenth bar has a value of approximately 40%.
* The seventeenth bar has a value of approximately 45%.
* The eighteenth bar has a value of approximately 50%.
* The nineteenth bar has a value of approximately 95%.
### Key Observations
* The chart shows a wide range of performance changes, from significantly worse to significantly better than the average human rater.
* The majority of configurations perform better than the average human rater, as indicated by the larger number of blue bars.
* There is one configuration that stands out as significantly better than the others, with a performance change of approximately 95%.
* The configurations that perform worse than the average human rater are clustered on the left side of the chart.
### Interpretation
The data suggests that using "CoC (try Python except LM state)" can lead to significant improvements in performance compared to the average human rater in certain configurations. However, it also shows that some configurations perform worse. The title suggests that the system being evaluated involves code generation or evaluation, and that trying Python, except for the LM state, is a key factor. The wide range of performance changes indicates that the choice of configuration is critical for achieving optimal results. The outlier configuration with a 95% improvement suggests that there is a particularly effective configuration that should be investigated further.