## Scatter Plot: 2D PCA of Embeddings (AlignVLM)
### Overview
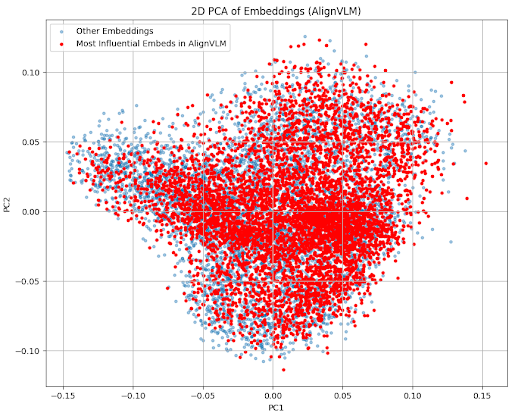
The image is a scatter plot visualizing the 2D Principal Component Analysis (PCA) of embeddings, specifically for the AlignVLM model. Two categories of embeddings are plotted: "Other Embeddings" (light blue) and "Most Influential Embeds in AlignVLM" (red). The plot shows the distribution of these embeddings along the first two principal components (PC1 and PC2).
### Components/Axes
* **Title:** 2D PCA of Embeddings (AlignVLM)
* **X-axis (PC1):** Ranges from approximately -0.15 to 0.15, with tick marks at -0.15, -0.10, -0.05, 0.00, 0.05, 0.10, and 0.15.
* **Y-axis (PC2):** Ranges from approximately -0.10 to 0.10, with tick marks at -0.10, -0.05, 0.00, 0.05, and 0.10.
* **Legend (top-left):**
* Light Blue: Other Embeddings
* Red: Most Influential Embeds in AlignVLM
### Detailed Analysis
* **Other Embeddings (Light Blue):** These points are more sparsely distributed across the plot. They appear to form a broader, less dense cluster.
* **Most Influential Embeds in AlignVLM (Red):** These points form a denser cluster, primarily concentrated in the central region of the plot. The red points appear to be more concentrated around the origin (0,0).
**Trend Verification and Data Points:**
* **Other Embeddings (Light Blue):** The light blue points are scattered across the plot, with a higher concentration in the central region. The distribution is relatively even across the PC1 axis, but there are fewer points at the extreme ends of the PC2 axis.
* **Most Influential Embeds in AlignVLM (Red):** The red points are heavily concentrated in the central region, forming a dense cluster. The density decreases as you move away from the origin.
### Key Observations
* The "Most Influential Embeds" are more tightly clustered than the "Other Embeddings," suggesting they have more similar characteristics in the reduced PCA space.
* The spread of "Other Embeddings" indicates greater variability among these embeddings.
* The concentration of "Most Influential Embeds" near the origin (0,0) suggests that these embeddings are well-represented by the first two principal components.
### Interpretation
The scatter plot visualizes the distribution of embeddings after applying PCA, highlighting the difference between "Other Embeddings" and "Most Influential Embeds" within the AlignVLM model. The tighter clustering of "Most Influential Embeds" suggests that these embeddings share more common features or patterns compared to the "Other Embeddings." This could indicate that the "Most Influential Embeds" are more important for the model's performance or represent more salient aspects of the data. The broader distribution of "Other Embeddings" implies greater diversity or variability within this set. The PCA projection effectively separates and visualizes these differences, providing insights into the structure and characteristics of the embeddings.