TECHNICAL ASSET FINGERPRINT
fb96ae5186028dcae2674737
Click to view fullscreen
Press ESC or click to close
FOUND IN PAPERS
EXPERT: gemini-2.0-flash VERSION 1
RUNTIME: nugit/gemini/gemini-2.0-flash
INTEL_VERIFIED
## Heatmap: Model Performance Across Error Categories
### Overview
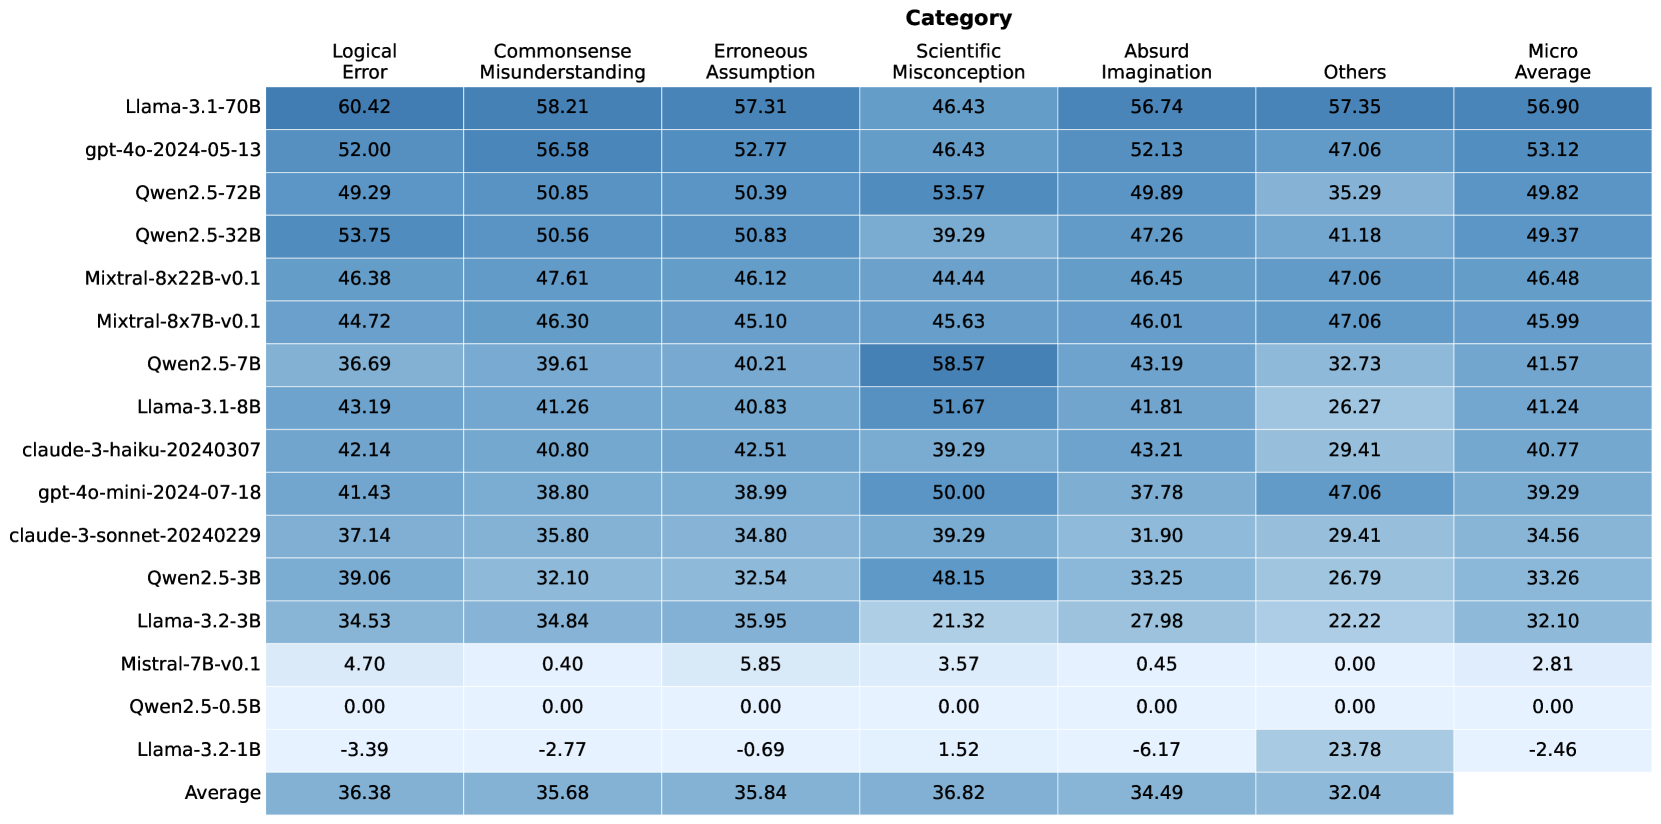
The image is a heatmap displaying the performance of various language models across different error categories. The rows represent the models, and the columns represent the error categories. The cells contain numerical values indicating the performance (likely error rate or a similar metric), with darker shades of blue indicating higher values. The last column shows the micro-average performance for each model.
### Components/Axes
* **Rows (Models):**
* Llama-3.1-70B
* gpt-4o-2024-05-13
* Qwen2.5-72B
* Qwen2.5-32B
* Mixtral-8x22B-v0.1
* Mixtral-8x7B-v0.1
* Qwen2.5-7B
* Llama-3.1-8B
* claude-3-haiku-20240307
* gpt-4o-mini-2024-07-18
* claude-3-sonnet-20240229
* Qwen2.5-3B
* Llama-3.2-3B
* Mistral-7B-v0.1
* Qwen2.5-0.5B
* Llama-3.2-1B
* Average
* **Columns (Error Categories):**
* Logical Error
* Commonsense Misunderstanding
* Erroneous Assumption
* Scientific Misconception
* Absurd Imagination
* Others
* Micro Average
### Detailed Analysis
Here's a breakdown of the data, row by row:
* **Llama-3.1-70B:**
* Logical Error: 60.42
* Commonsense Misunderstanding: 58.21
* Erroneous Assumption: 57.31
* Scientific Misconception: 46.43
* Absurd Imagination: 56.74
* Others: 57.35
* Micro Average: 56.90
* **gpt-4o-2024-05-13:**
* Logical Error: 52.00
* Commonsense Misunderstanding: 56.58
* Erroneous Assumption: 52.77
* Scientific Misconception: 46.43
* Absurd Imagination: 52.13
* Others: 47.06
* Micro Average: 53.12
* **Qwen2.5-72B:**
* Logical Error: 49.29
* Commonsense Misunderstanding: 50.85
* Erroneous Assumption: 50.39
* Scientific Misconception: 53.57
* Absurd Imagination: 49.89
* Others: 35.29
* Micro Average: 49.82
* **Qwen2.5-32B:**
* Logical Error: 53.75
* Commonsense Misunderstanding: 50.56
* Erroneous Assumption: 50.83
* Scientific Misconception: 39.29
* Absurd Imagination: 47.26
* Others: 41.18
* Micro Average: 49.37
* **Mixtral-8x22B-v0.1:**
* Logical Error: 46.38
* Commonsense Misunderstanding: 47.61
* Erroneous Assumption: 46.12
* Scientific Misconception: 44.44
* Absurd Imagination: 46.45
* Others: 47.06
* Micro Average: 46.48
* **Mixtral-8x7B-v0.1:**
* Logical Error: 44.72
* Commonsense Misunderstanding: 46.30
* Erroneous Assumption: 45.10
* Scientific Misconception: 45.63
* Absurd Imagination: 46.01
* Others: 47.06
* Micro Average: 45.99
* **Qwen2.5-7B:**
* Logical Error: 36.69
* Commonsense Misunderstanding: 39.61
* Erroneous Assumption: 40.21
* Scientific Misconception: 58.57
* Absurd Imagination: 43.19
* Others: 32.73
* Micro Average: 41.57
* **Llama-3.1-8B:**
* Logical Error: 43.19
* Commonsense Misunderstanding: 41.26
* Erroneous Assumption: 40.83
* Scientific Misconception: 51.67
* Absurd Imagination: 41.81
* Others: 26.27
* Micro Average: 41.24
* **claude-3-haiku-20240307:**
* Logical Error: 42.14
* Commonsense Misunderstanding: 40.80
* Erroneous Assumption: 42.51
* Scientific Misconception: 39.29
* Absurd Imagination: 43.21
* Others: 29.41
* Micro Average: 40.77
* **gpt-4o-mini-2024-07-18:**
* Logical Error: 41.43
* Commonsense Misunderstanding: 38.80
* Erroneous Assumption: 38.99
* Scientific Misconception: 50.00
* Absurd Imagination: 37.78
* Others: 47.06
* Micro Average: 39.29
* **claude-3-sonnet-20240229:**
* Logical Error: 37.14
* Commonsense Misunderstanding: 35.80
* Erroneous Assumption: 34.80
* Scientific Misconception: 39.29
* Absurd Imagination: 31.90
* Others: 29.41
* Micro Average: 34.56
* **Qwen2.5-3B:**
* Logical Error: 39.06
* Commonsense Misunderstanding: 32.10
* Erroneous Assumption: 32.54
* Scientific Misconception: 48.15
* Absurd Imagination: 33.25
* Others: 26.79
* Micro Average: 33.26
* **Llama-3.2-3B:**
* Logical Error: 34.53
* Commonsense Misunderstanding: 34.84
* Erroneous Assumption: 35.95
* Scientific Misconception: 21.32
* Absurd Imagination: 27.98
* Others: 22.22
* Micro Average: 32.10
* **Mistral-7B-v0.1:**
* Logical Error: 4.70
* Commonsense Misunderstanding: 0.40
* Erroneous Assumption: 5.85
* Scientific Misconception: 3.57
* Absurd Imagination: 0.45
* Others: 0.00
* Micro Average: 2.81
* **Qwen2.5-0.5B:**
* Logical Error: 0.00
* Commonsense Misunderstanding: 0.00
* Erroneous Assumption: 0.00
* Scientific Misconception: 0.00
* Absurd Imagination: 0.00
* Others: 0.00
* Micro Average: 0.00
* **Llama-3.2-1B:**
* Logical Error: -3.39
* Commonsense Misunderstanding: -2.77
* Erroneous Assumption: -0.69
* Scientific Misconception: 1.52
* Absurd Imagination: -6.17
* Others: 23.78
* Micro Average: -2.46
* **Average:**
* Logical Error: 36.38
* Commonsense Misunderstanding: 35.68
* Erroneous Assumption: 35.84
* Scientific Misconception: 36.82
* Absurd Imagination: 34.49
* Others: 32.04
### Key Observations
* **Llama-3.1-70B** has the highest Logical Error rate (60.42) and the highest Commonsense Misunderstanding rate (58.21).
* **Mistral-7B-v0.1, Qwen2.5-0.5B, and Llama-3.2-1B** generally have the lowest error rates across most categories. Llama-3.2-1B even has negative error rates in some categories, which is unusual and may indicate a different interpretation of the metric.
* **Qwen2.5-7B** has a significantly higher Scientific Misconception rate (58.57) compared to its other error rates.
* The "Others" category has the lowest average value (32.04) compared to other error categories.
* The average values across error categories are relatively similar, ranging from 32.04 to 36.82.
### Interpretation
The heatmap provides a comparative analysis of language model performance across various error types. It highlights the strengths and weaknesses of each model in specific areas. For example, Llama-3.1-70B seems to struggle more with logical errors and commonsense misunderstandings compared to other models. The negative values for Llama-3.2-1B suggest that the metric used might be a difference or improvement score relative to a baseline, rather than a raw error rate. The relatively low error rates for Mistral-7B-v0.1 and Qwen2.5-0.5B suggest that these models are more robust in avoiding these types of errors, or that they are smaller models that are less likely to generate complex errors. The high Scientific Misconception rate for Qwen2.5-7B could indicate a need for improved training data or model architecture to address this specific weakness. Overall, the heatmap is a useful tool for identifying areas where language models can be improved and for selecting the most appropriate model for a given task based on its error profile.
DECODING INTELLIGENCE...