TECHNICAL ASSET FINGERPRINT
fb96ae5186028dcae2674737
Click to view fullscreen
Press ESC or click to close
FOUND IN PAPERS
EXPERT: gemini-2.5-flash-lite-free VERSION 1
RUNTIME: google-free/gemini-2.5-flash-lite
INTEL_VERIFIED
## Data Table: Model Performance Metrics by Category
### Overview
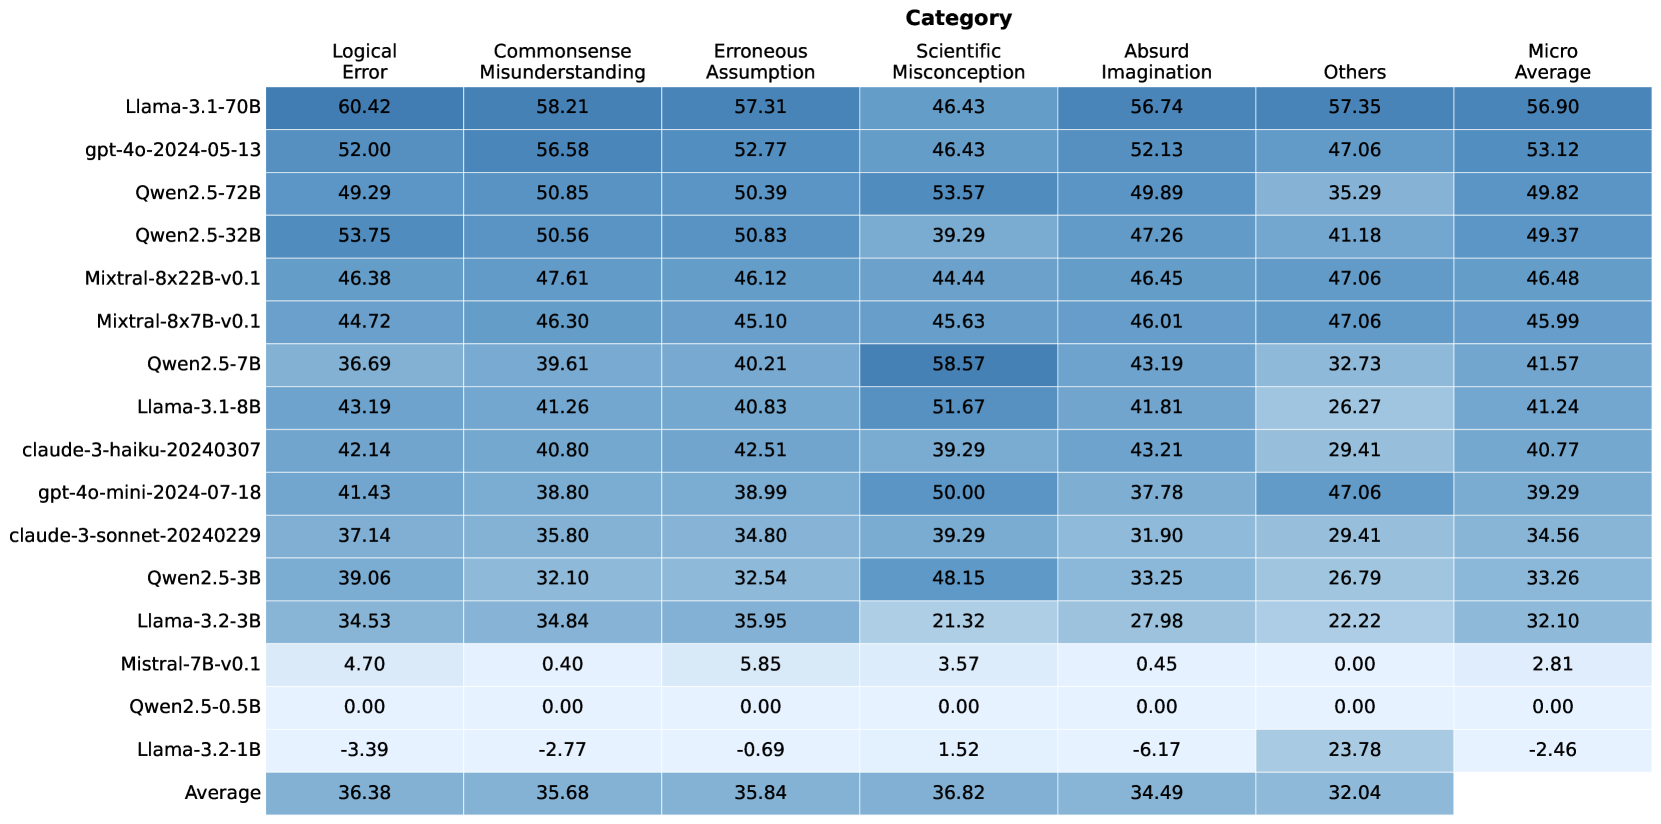
The image displays a data table presenting performance metrics for various language models across different categories of evaluation. The table includes model names on the left-hand side and performance scores for "Logical Error," "Commonsense Misunderstanding," "Erroneous Assumption," "Scientific Misconception," "Absurd Imagination," "Others," and "Micro Average" as columns. The data is visually represented with a color gradient, where darker shades of blue generally indicate higher scores. An "Average" row is also included at the bottom.
### Components/Axes
**Row Labels (Model Names):**
* Llama-3.1-70B
* gpt-4o-2024-05-13
* Qwen2.5-72B
* Qwen2.5-32B
* Mixtral-8x22B-v0.1
* Mixtral-8x7B-v0.1
* Qwen2.5-7B
* Llama-3.1-8B
* claude-3-haiku-20240307
* gpt-4o-mini-2024-07-18
* claude-3-sonnet-20240229
* Qwen2.5-3B
* Llama-3.2-3B
* Mistral-7B-v0.1
* Qwen2.5-0.5B
* Llama-3.2-1B
* Average
**Column Headers (Categories):**
* Logical Error
* Commonsense Misunderstanding
* Erroneous Assumption
* Scientific Misconception
* Absurd Imagination
* Others
* Micro Average
**Data Values:** Numerical scores are presented for each model within each category. The values range from approximately -3.39 to 60.42.
**Color Gradient:** A color gradient is applied to the data cells, with darker blues representing higher values and lighter blues (or white for very low/negative values) representing lower values. This serves as a visual aid for quickly identifying performance differences.
### Detailed Analysis
The table presents the following data points:
| Model Name | Logical Error | Commonsense Misunderstanding | Erroneous Assumption | Scientific Misconception | Absurd Imagination | Others | Micro Average |
| :------------------------- | :------------ | :--------------------------- | :------------------- | :----------------------- | :----------------- | :----- | :------------ |
| Llama-3.1-70B | 60.42 | 58.21 | 57.31 | 46.43 | 56.74 | 57.35 | 56.90 |
| gpt-4o-2024-05-13 | 52.00 | 56.58 | 52.77 | 46.43 | 52.13 | 47.06 | 53.12 |
| Qwen2.5-72B | 49.29 | 50.85 | 50.39 | 53.57 | 49.89 | 35.29 | 49.82 |
| Qwen2.5-32B | 53.75 | 50.56 | 50.83 | 39.29 | 47.26 | 41.18 | 49.37 |
| Mixtral-8x22B-v0.1 | 46.38 | 47.61 | 46.12 | 44.44 | 46.45 | 47.06 | 46.48 |
| Mixtral-8x7B-v0.1 | 44.72 | 46.30 | 45.10 | 45.63 | 46.01 | 47.06 | 45.99 |
| Qwen2.5-7B | 36.69 | 39.61 | 40.21 | 58.57 | 43.19 | 32.73 | 41.57 |
| Llama-3.1-8B | 43.19 | 41.26 | 40.83 | 51.67 | 41.81 | 26.27 | 41.24 |
| claude-3-haiku-20240307 | 42.14 | 40.80 | 42.51 | 39.29 | 43.21 | 29.41 | 40.77 |
| gpt-4o-mini-2024-07-18 | 41.43 | 38.80 | 38.99 | 50.00 | 37.78 | 47.06 | 39.29 |
| claude-3-sonnet-20240229 | 37.14 | 35.80 | 34.80 | 39.29 | 31.90 | 29.41 | 34.56 |
| Qwen2.5-3B | 39.06 | 32.10 | 32.54 | 48.15 | 33.25 | 26.79 | 33.26 |
| Llama-3.2-3B | 34.53 | 34.84 | 35.95 | 21.32 | 27.98 | 22.22 | 32.10 |
| Mistral-7B-v0.1 | 4.70 | 0.40 | 5.85 | 3.57 | 0.45 | 0.00 | 2.81 |
| Qwen2.5-0.5B | 0.00 | 0.00 | 0.00 | 0.00 | 0.00 | 0.00 | 0.00 |
| Llama-3.2-1B | -3.39 | -2.77 | -0.69 | 1.52 | -6.17 | 23.78 | -2.46 |
| **Average** | **36.38** | **35.68** | **35.84** | **36.82** | **34.49** | **32.04** | **35.49** |
**Trend Verification:**
* **Logical Error:** Generally trends downwards from the top models (Llama-3.1-70B, Qwen2.5-32B) to the bottom models (Mistral-7B-v0.1, Qwen2.5-0.5B, Llama-3.2-1B). The average is around 36.38.
* **Commonsense Misunderstanding:** Similar to Logical Error, it generally trends downwards, with higher scores for top models and lower scores for bottom models. The average is around 35.68.
* **Erroneous Assumption:** Shows a similar downward trend, with a few exceptions like Qwen2.5-72B and Qwen2.5-32B having higher scores than some models above them. The average is around 35.84.
* **Scientific Misconception:** This category shows more variability. While some top models have moderate scores, Qwen2.5-7B and Llama-3.1-8B show exceptionally high scores (58.57 and 51.67 respectively), deviating from the general downward trend. The average is around 36.82.
* **Absurd Imagination:** Generally trends downwards, with Llama-3.1-70B and gpt-4o-2024-05-13 scoring high. The average is around 34.49.
* **Others:** This category also shows significant variability. Some models like Llama-3.1-70B and gpt-4o-2024-05-13 score high, while others like Mistral-7B-v0.1 and Qwen2.5-0.5B score very low or zero. The average is around 32.04.
* **Micro Average:** This column generally follows the overall trend of the other categories, showing higher scores for the top-performing models and lower scores for the bottom ones. The average is around 35.49.
### Key Observations
* **Top Performers:** Llama-3.1-70B and gpt-4o-2024-05-13 consistently achieve high scores across most categories, particularly in "Logical Error," "Commonsense Misunderstanding," "Erroneous Assumption," and "Absurd Imagination."
* **Outliers in Scientific Misconception:** Qwen2.5-7B (58.57) and Llama-3.1-8B (51.67) exhibit significantly higher scores in "Scientific Misconception" compared to most other models, including some that perform better overall.
* **Low Performers:** Mistral-7B-v0.1, Qwen2.5-0.5B, and Llama-3.2-1B show very low or negative scores across multiple categories, indicating poor performance. Llama-3.2-1B has a negative score in "Logical Error," "Commonsense Misunderstanding," "Erroneous Assumption," and "Absurd Imagination."
* **"Others" Category Variability:** The "Others" category shows the most pronounced variability, with scores ranging from 0.00 to 57.35. This suggests that performance in this category is highly model-dependent and not consistently correlated with other metrics.
* **Average Performance:** The average scores across all models indicate that "Scientific Misconception" (36.82) and "Logical Error" (36.38) are the categories with the highest average scores, while "Others" (32.04) has the lowest average score.
### Interpretation
This data table provides a comparative analysis of different language models across various error and performance categories. The scores likely represent a measure of accuracy or correctness, where higher values indicate better performance (fewer errors or better understanding).
* **Model Strengths and Weaknesses:** The table clearly delineates which models excel in specific areas. For instance, Llama-3.1-70B and gpt-4o-2024-05-13 appear to be robust generalists, performing well across a broad spectrum of metrics. Conversely, models like Mistral-7B-v0.1 and Qwen2.5-0.5B seem to struggle significantly, potentially indicating limitations in their training data or architecture for these specific tasks.
* **Category-Specific Performance:** The significant spike in "Scientific Misconception" for Qwen2.5-7B and Llama-3.1-8B suggests that these models might have been specifically trained or are inherently better at handling scientific reasoning or knowledge. This highlights that a single "best" model may not exist; rather, the optimal choice depends on the intended application and the types of errors that are most critical to avoid.
* **"Others" as a Catch-all:** The "Others" category's high variance implies it might encompass a diverse set of tasks or error types that are not well-defined by the other categories. Its low average score suggests that models, in general, may find these tasks more challenging.
* **Negative Scores:** The presence of negative scores, particularly for Llama-3.2-1B, is noteworthy. This could indicate a performance level below random chance or a specific scoring mechanism that penalizes incorrect responses severely.
* **Overall Trend:** The general downward trend in scores from the top-performing models to the bottom-performing ones across most categories reinforces the idea of a hierarchy in model capabilities. The "Micro Average" serves as a useful aggregate metric, but it's crucial to examine the individual category scores to understand the nuances of each model's performance. The data suggests that while some models are generally strong, others have specific areas of exceptional strength or weakness.
DECODING INTELLIGENCE...