## Diagram: Neural Association Model
### Overview
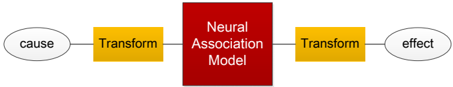
The image is a diagram illustrating a Neural Association Model. It shows a flow from "cause" to "effect" with "Transform" steps before and after the "Neural Association Model" block.
### Components/Axes
* **Nodes:**
* "cause" (white oval)
* "effect" (white oval)
* **Processes:**
* "Transform" (yellow rectangle, appears twice)
* "Neural Association Model" (red square)
* **Connectors:** Lines connecting the nodes and processes, indicating flow.
### Detailed Analysis or ### Content Details
1. **Cause Node:** A white oval labeled "cause" is located on the left.
2. **First Transform:** A yellow rectangle labeled "Transform" is connected to the "cause" node via a line.
3. **Neural Association Model:** A red square labeled "Neural Association Model" is connected to the first "Transform" block.
4. **Second Transform:** Another yellow rectangle labeled "Transform" is connected to the "Neural Association Model" block.
5. **Effect Node:** A white oval labeled "effect" is connected to the second "Transform" block.
### Key Observations
* The diagram represents a linear flow from cause to effect.
* The "Neural Association Model" is central to the diagram, suggesting it is the core process.
* "Transform" blocks are used before and after the "Neural Association Model," indicating pre-processing and post-processing steps.
### Interpretation
The diagram illustrates a simplified model of how a cause leads to an effect through a neural association model. The "Transform" blocks likely represent data transformation or feature extraction steps necessary for the model to process the input ("cause") and generate the output ("effect"). The model suggests that the relationship between cause and effect is not direct but mediated by transformations and the neural association model itself.