## Diagram: Process Flow with Splicing and Feedback Loops
### Overview
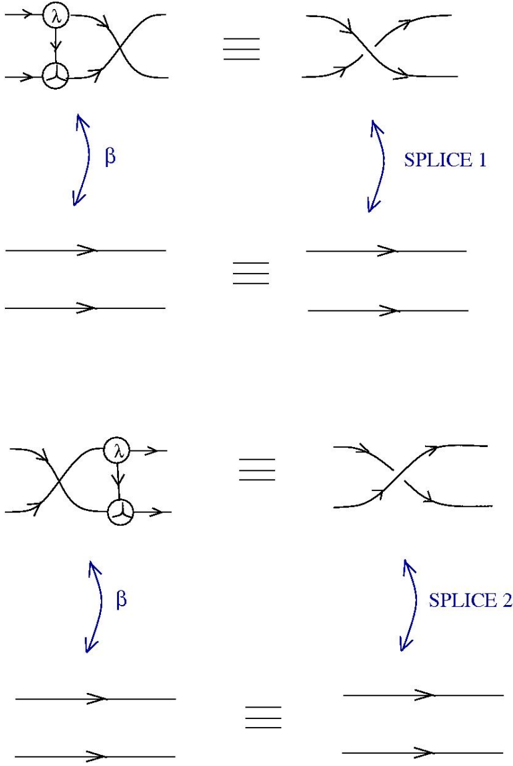
The image depicts two equivalent process flow diagrams connected by equivalence symbols (≡). Each diagram illustrates a sequence of interactions involving branching, merging, and feedback loops, labeled with symbols (λ, β) and annotations ("SPLICE 1", "SPLICE 2"). The diagrams emphasize directional flow (arrows) and equivalence between transformations.
---
### Components/Axes
1. **Primary Elements**:
- **Arrows**: Indicate directional flow (left-to-right, upward/downward loops).
- **Circles with Symbols**:
- **λ (Lambda)**: Appears in two nodes, likely representing input or transformation points.
- **Three-way Junction**: A node with three outgoing paths, suggesting decision or merging logic.
- **β (Beta)**: Circular arrows below each diagram, representing feedback loops.
- **SPLICE 1/SPLICE 2**: Labels above the right-side diagrams, indicating distinct output paths.
2. **Equivalence Symbols (≡)**: Positioned between the left and right diagrams, denoting equivalence of processes.
3. **Spatial Layout**:
- **Top Row**: Left diagram (λ → three-way junction → λ) ≡ Right diagram (branching/merging arrows).
- **Bottom Row**: Left diagram (λ → three-way junction → λ) ≡ Right diagram (branching/merging arrows).
- **Feedback Loops (β)**: Positioned below each main diagram, looping vertically.
---
### Detailed Analysis
1. **Top Diagram**:
- **Left Side**:
- Input (λ) enters a three-way junction.
- Two paths merge into a single output (λ).
- **Right Side**:
- Two parallel input streams converge into a single output stream.
- **Equivalence**: The left and right diagrams represent the same process via different visual abstractions.
2. **Bottom Diagram**:
- **Left Side**:
- Input (λ) enters a three-way junction.
- Two paths split into separate outputs (λ).
- **Right Side**:
- A single input stream splits into two parallel outputs.
- **Equivalence**: Mirrors the top diagram’s logic but with inverted flow (splitting vs. merging).
3. **Feedback Loops (β)**:
- Circular arrows below each diagram suggest iterative processes or cyclical dependencies.
---
### Key Observations
- **Symmetry**: Both diagrams exhibit mirrored logic (splitting/merging) with equivalence.
- **Symbol Consistency**: λ appears in input/output nodes, while β governs feedback.
- **No Numerical Data**: The diagrams are conceptual, lacking quantitative values or scales.
---
### Interpretation
The diagrams likely represent **process equivalence in a system** (e.g., physics, engineering, or computer science). The λ symbols may denote inputs/outputs, while the three-way junction and β loops imply decision points and iterative feedback. The "SPLICE" labels suggest discrete output paths (SPLICE 1/2) resulting from the process. The equivalence symbols (≡) emphasize that the left and right diagrams are functionally identical despite differing visual representations. This could model scenarios like signal processing, data routing, or theoretical transformations where multiple pathways yield the same outcome.