## Line Graph: Current Top Score vs. Cumulative Evolutionary Time
### Overview
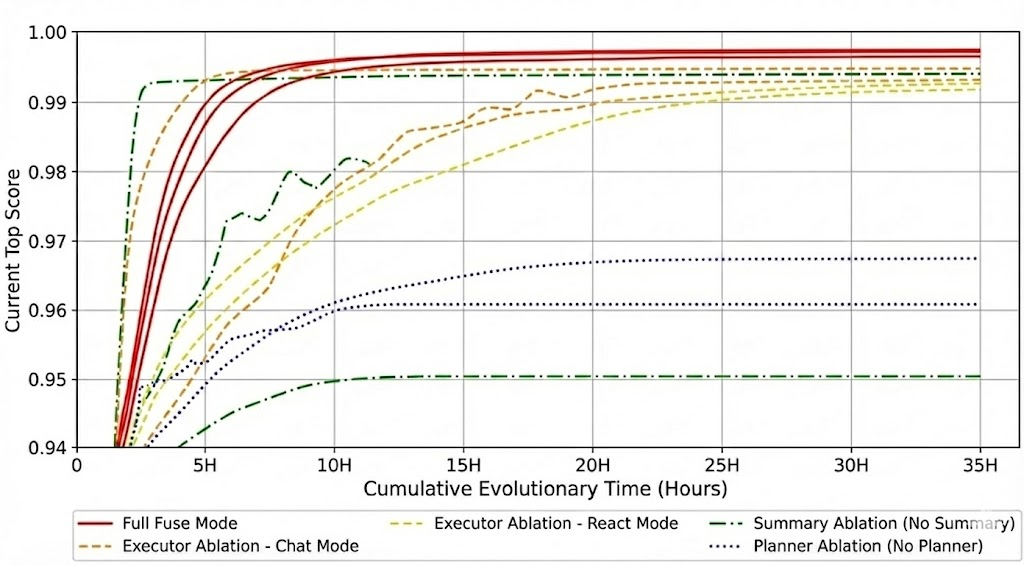
The graph displays the performance of six different system configurations over 35 hours of cumulative evolutionary time. The y-axis measures "Current Top Score" (0.94–1.00), while the x-axis tracks time in 5-hour increments. All lines show rapid initial improvement followed by plateauing performance.
### Components/Axes
- **X-axis**: Cumulative Evolutionary Time (Hours)
Markers: 0, 5H, 10H, 15H, 20H, 25H, 30H, 35H
- **Y-axis**: Current Top Score (0.94–1.00)
- **Legend**:
- Red solid: Full Fuse Mode
- Brown dashed: Executor Ablation - Chat Mode
- Yellow dashed: Executor Ablation - React Mode
- Green dash-dot: Summary Ablation (No Summary)
- Purple dotted: Planner Ablation (No Planner)
- Black dotted: Summary Ablation + Planner Ablation (No Summary + No Planner)
### Detailed Analysis
1. **Full Fuse Mode (Red Solid Line)**
- Starts at ~0.94 at 0H, peaks at ~0.995 by 5H, and plateaus at ~0.998 by 10H.
- Maintains near-perfect score (0.998–0.999) for remaining duration.
2. **Executor Ablation - Chat Mode (Brown Dashed Line)**
- Begins at ~0.94, rises to ~0.985 by 10H, then plateaus at ~0.992 by 15H.
- Shows minor fluctuations (~0.991–0.993) after 20H.
3. **Executor Ablation - React Mode (Yellow Dashed Line)**
- Similar trajectory to Chat Mode but slightly lower: ~0.982 by 10H, ~0.990 by 15H.
- Stabilizes at ~0.991–0.993 after 20H.
4. **Summary Ablation (Green Dash-Dot Line)**
- Starts at ~0.94, reaches ~0.975 by 10H, then plateaus at ~0.985 by 15H.
- Dips slightly (~0.984–0.986) after 20H.
5. **Planner Ablation (Purple Dotted Line)**
- Begins at ~0.94, climbs to ~0.96 by 10H, then plateaus at ~0.965 by 15H.
- Remains flat (~0.963–0.967) for the remainder of the graph.
6. **Summary + Planner Ablation (Black Dotted Line)**
- Lowest performance: ~0.94 at 0H, rises to ~0.95 by 10H, plateaus at ~0.955 by 15H.
- Stays flat (~0.953–0.957) after 20H.
### Key Observations
- **Performance Hierarchy**: Full Fuse Mode dominates, followed by Executor Ablation modes, then Summary/Planner Ablation modes.
- **Rapid Convergence**: All configurations stabilize within 10–15 hours, with minimal improvement afterward.
- **Ablation Impact**: Removing Summary or Planner components reduces scores by ~0.02–0.04 compared to Full Fuse Mode.
- **No Summary + No Planner**: Worst-performing configuration, consistently trailing others by ~0.04–0.05.
### Interpretation
The graph demonstrates that the Full Fuse Mode achieves the highest performance, with ablation studies revealing the critical role of Summary and Planner components. The Executor Ablation modes (Chat/React) show near-optimal performance, suggesting their configurations are robust. The steep initial improvement across all modes indicates rapid adaptation, while the plateaus suggest diminishing returns after ~15 hours. The Summary Ablation line’s dip at 10H may reflect temporary instability during configuration adjustments. Overall, the data underscores the importance of integrated components for maintaining high scores in evolutionary systems.