## Grid Diagram: Labeled Matrix with Highlighted Cells
### Overview
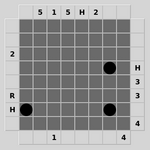
The image depicts a 5x5 grid with labeled rows, columns, and highlighted cells. The grid uses alphanumeric labels for rows and columns, with specific cells marked by black circles. No numerical data or color gradients are present, suggesting a categorical or positional representation.
### Components/Axes
- **Rows (Left Axis)**: Labeled from top to bottom as `H`, `R`, `3`, `2`, `4`.
- **Columns (Top Axis)**: Labeled from left to right as `5`, `1`, `5`, `H`, `2`.
- **Highlighted Cells**: Three black circles located at:
- Row `H`, Column `1` (top-left quadrant).
- Row `R`, Column `3` (middle-right quadrant).
- Row `3`, Column `H` (bottom-center quadrant).
### Detailed Analysis
- **Row Labels**:
- `H` (top row), `R` (second row), `3` (third row), `2` (fourth row), `4` (bottom row).
- **Column Labels**:
- `5` (first column), `1` (second column), `5` (third column), `H` (fourth column), `2` (fifth column).
- **Highlighted Cells**:
- **Cell (H,1)**: Intersection of row `H` and column `1`.
- **Cell (R,3)**: Intersection of row `R` and column `3`.
- **Cell (3,H)**: Intersection of row `3` and column `H`.
### Key Observations
1. **Asymmetrical Labeling**: Columns repeat the label `5` (first and third columns), while rows use unique labels except for `3`, `2`, `4`.
2. **Highlighted Cells**: The three black circles are distributed across distinct quadrants, suggesting no obvious spatial pattern.
3. **Missing Data**: No numerical values, gradients, or legends are present to quantify relationships between labels.
### Interpretation
This diagram likely represents a categorical matrix where specific intersections (e.g., `H` row and `1` column) are marked for emphasis. The repeated column label `5` and the use of letters (`H`, `R`, `H`) alongside numbers suggest a hybrid labeling system, possibly for tracking events, categories, or positions in a structured dataset. The absence of numerical data or a legend limits quantitative analysis, but the highlighted cells may indicate priority, occurrence, or relationships between row and column labels.
**Note**: The image contains no explicit textual data beyond labels and symbols. All interpretations are based on positional and structural analysis.