## Matrix Diagram: Labeled Grid with Data Points
### Overview
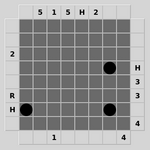
The image displays a 5x5 grid (matrix) with alphanumeric labels along all four sides. Three solid black circular data points are placed at specific intersections within the grid. The diagram appears to represent a sparse data matrix or a mapping of relationships between row and column categories.
### Components/Axes
* **Grid Structure:** A 5x5 matrix of squares, forming 5 rows and 5 columns.
* **Top Axis (Column Headers):** Labels positioned above each column, from left to right: `5`, `1`, `5`, `H`, `2`.
* **Left Axis (Row Headers):** Labels positioned to the left of each row, from top to bottom: `2`, `R`, `H`. (Note: Only three labels are present for five rows. The top two rows and the bottom row on this axis are unlabeled).
* **Right Axis (Row Annotations):** Labels positioned to the right of each row, from top to bottom: `H`, `3`, `3`, `4`. (Note: Only four labels are present for five rows. The bottom row on this axis is unlabeled).
* **Bottom Axis (Column Annotations):** Numerical labels positioned below specific columns. The number `1` is centered below the second column. The number `4` is centered below the fifth column.
* **Data Points:** Three solid black circles, each occupying a single grid cell.
### Detailed Analysis
**Data Point Locations (Row, Column):**
1. **Point 1:** Located at the intersection of the **4th row** and the **1st column**.
2. **Point 2:** Located at the intersection of the **2nd row** and the **5th column**.
3. **Point 3:** Located at the intersection of the **4th row** and the **5th column**.
**Label Transcription & Spatial Mapping:**
* **Row 1:** Left Label: (Unlabeled). Right Label: `H`.
* **Row 2:** Left Label: `2`. Right Label: `3`. Contains a data point in Column 5.
* **Row 3:** Left Label: `R`. Right Label: `3`.
* **Row 4:** Left Label: `H`. Right Label: `4`. Contains data points in Column 1 and Column 5.
* **Row 5:** Left Label: (Unlabeled). Right Label: (Unlabeled).
* **Column 1:** Top Label: `5`. Bottom Annotation: (Unlabeled). Contains a data point in Row 4.
* **Column 2:** Top Label: `1`. Bottom Annotation: `1`.
* **Column 3:** Top Label: `5`. Bottom Annotation: (Unlabeled).
* **Column 4:** Top Label: `H`. Bottom Annotation: (Unlabeled).
* **Column 5:** Top Label: `2`. Bottom Annotation: `4`. Contains data points in Row 2 and Row 4.
### Key Observations
1. **Sparse Data:** Only 3 out of 25 possible grid cells (12%) are occupied by data points.
2. **Concentration:** Two of the three data points are located in the **5th column**, specifically in rows 2 and 4.
3. **Label Discrepancy:** The left and right row labels do not correspond one-to-one. The left axis has labels for rows 2, 3, and 4, while the right axis has labels for rows 1, 2, 3, and 4. This suggests the left and right labels may represent different attributes or categories for the rows.
4. **Repeating Labels:** The label `H` appears on all four axes (Top Column 4, Left Row 4, Right Row 1). The number `5` appears twice on the top axis (Columns 1 and 3). The number `3` appears twice on the right axis (Rows 2 and 3).
5. **Annotation Placement:** The bottom axis annotations (`1` and `4`) are not aligned with the columns that have the most data points (Column 5 has two points but is annotated with `4`; Column 1 has one point but is not annotated).
### Interpretation
This diagram likely represents a **cross-tabulation or relationship map** between two sets of categories (rows and columns), with additional metadata attached via the side labels.
* **What the data suggests:** The black dots mark specific, pre-defined relationships or occurrences. The concentration in Column 5 suggests that the category represented by the column header `2` (with bottom annotation `4`) has a strong association with the row categories labeled `2` (Right: `3`) and `H` (Right: `4`).
* **How elements relate:** The grid is the core relational structure. The top and left labels likely define the primary row/column categories. The right and bottom labels appear to be secondary attributes or scores associated with those primary categories. For example, the row with Left Label `H` has a Right Label `4`, and the column with Top Label `2` has a Bottom Annotation `4`. The meaning of `H` is ambiguous—it could stand for "High," a specific code, or a category initial.
* **Notable anomalies:** The lack of symmetry in row labeling is the most significant anomaly. It implies the left and right labels are not direct equivalents but serve different purposes. The placement of bottom annotations only under columns 2 and 5 is also selective, possibly highlighting those columns as having special significance (e.g., being "active" or "scored" categories).
* **Potential Purpose:** This could be a visual key for a database, a mapping of experimental results, a component of a decision matrix, or a diagram showing connections in a network where rows and nodes are entities and the dots represent links. The alphanumeric labels suggest a coded system rather than plain English descriptions.