## Line Graphs: Accuracy Comparison Across Categories
### Overview
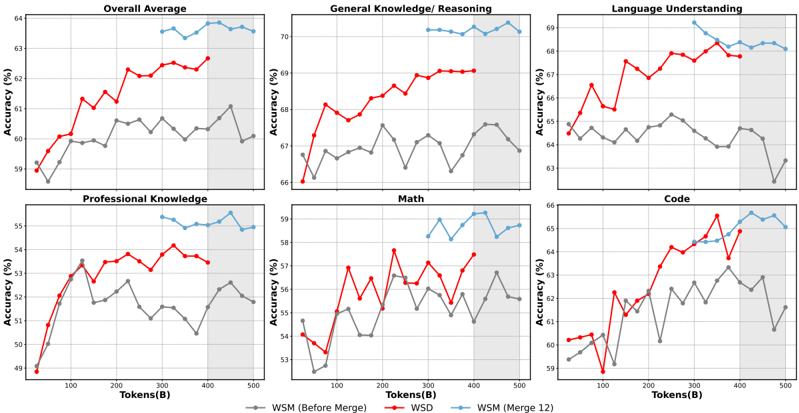
The image contains six line graphs comparing accuracy percentages across different categories (Overall Average, General Knowledge/Reasoning, Language Understanding, Professional Knowledge, Math, Code). Each graph tracks two data series: "WSM (Before Merge)" (gray line) and "WSD (Merge 12)" (red line) against token counts (100–500B). The graphs show trends in performance metrics, with notable fluctuations and convergence patterns.
---
### Components/Axes
- **X-Axis**: Tokens (B) with markers at 100, 200, 300, 400, 500.
- **Y-Axis**: Accuracy (%) ranging from 49% to 64%.
- **Legends**:
- Gray line: "WSM (Before Merge)"
- Red line: "WSD (Merge 12)"
- **Graph Titles**:
- Overall Average
- General Knowledge/Reasoning
- Language Understanding
- Professional Knowledge
- Math
- Code
---
### Detailed Analysis
#### Overall Average
- **WSM (Before Merge)**: Starts at ~50%, fluctuates between ~50–60%, peaks at ~60% at 400B tokens, then drops to ~59% at 500B.
- **WSD (Merge 12)**: Starts at ~50%, rises steadily to ~63% at 400B, then dips slightly to ~62% at 500B.
#### General Knowledge/Reasoning
- **WSM (Before Merge)**: Begins at ~56%, fluctuates between ~55–60%, peaks at ~60% at 400B, then drops to ~59% at 500B.
- **WSD (Merge 12)**: Starts at ~66%, rises to ~69% at 300B, dips to ~67% at 400B, then stabilizes at ~68% at 500B.
#### Language Understanding
- **WSM (Before Merge)**: Starts at ~63%, fluctuates between ~62–65%, peaks at ~65% at 300B, then drops to ~63% at 500B.
- **WSD (Merge 12)**: Begins at ~66%, rises to ~69% at 300B, dips to ~68% at 400B, then stabilizes at ~68% at 500B.
#### Professional Knowledge
- **WSM (Before Merge)**: Starts at ~49%, rises to ~53% at 300B, dips to ~51% at 400B, then recovers to ~52% at 500B.
- **WSD (Merge 12)**: Begins at ~50%, rises to ~54% at 300B, dips to ~53% at 400B, then stabilizes at ~54% at 500B.
#### Math
- **WSM (Before Merge)**: Starts at ~53%, fluctuates between ~52–57%, peaks at ~57% at 300B, then drops to ~55% at 500B.
- **WSD (Merge 12)**: Begins at ~54%, rises to ~58% at 300B, dips to ~57% at 400B, then stabilizes at ~57% at 500B.
#### Code
- **WSM (Before Merge)**: Starts at ~59%, fluctuates between ~58–63%, peaks at ~63% at 300B, then drops to ~62% at 500B.
- **WSD (Merge 12)**: Begins at ~60%, rises to ~65% at 300B, dips to ~64% at 400B, then stabilizes at ~65% at 500B.
---
### Key Observations
1. **Consistent Improvement**: "WSD (Merge 12)" (red) consistently outperforms "WSM (Before Merge)" (gray) across all categories, with larger gaps in Math and Code.
2. **Fluctuations in WSM**: The gray line shows erratic behavior (e.g., dips below 50% in Professional Knowledge at 100B tokens), suggesting instability pre-merge.
3. **Convergence at High Tokens**: In most categories, the performance gap narrows at 500B tokens, though "WSD" remains superior.
4. **Outliers**:
- Math: WSM dips below 52% at 100B tokens.
- Code: WSD peaks sharply at 300B tokens (~65%).
---
### Interpretation
The data suggests that merging (WSD Merge 12) significantly improves accuracy compared to the pre-merge state (WSM Before Merge). The improvement is most pronounced in Math and Code, where "WSD" achieves ~65% accuracy versus ~63% for "WSM." The fluctuations in "WSM" indicate potential instability or variability in performance before merging, while "WSD" shows more stable gains. The narrowing gap at 500B tokens implies diminishing returns at higher token counts, but "WSD" retains a consistent advantage. This could reflect architectural improvements or optimization benefits from merging.