## Diagram: Evidence and Innocence Model
### Overview
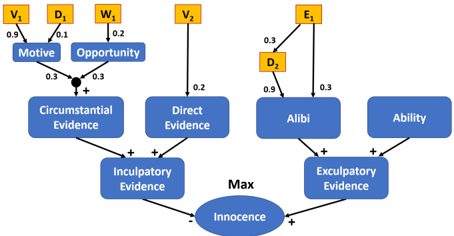
The image presents a causal loop diagram illustrating the relationship between various types of evidence (Motive, Opportunity, Direct Evidence, Alibi, Ability) and the concepts of Innocence, Circumstantial Evidence, Incultpatory Evidence, and Exculpatory Evidence. The diagram uses arrows to indicate causal relationships, with "+" signs indicating positive (reinforcing) relationships and the absence of a sign implying a negative (balancing) relationship. Numerical values are associated with some arrows, representing the strength of the causal link.
### Components/Axes
The diagram consists of the following components:
* **Variables:** V1, D1, W1, V2, E1, D2. These are represented by yellow boxes.
* **Concepts:** Motive, Opportunity, Circumstantial Evidence, Direct Evidence, Alibi, Ability, Incultpatory Evidence, Exculpatory Evidence, Innocence, Max. These are represented by blue boxes.
* **Causal Links:** Arrows connecting the variables and concepts, with associated numerical values.
* **Polarity:** "+" signs indicating positive causal relationships.
### Detailed Analysis
The diagram can be divided into two main sections: a left side focusing on evidence leading towards guilt and a right side focusing on evidence leading towards innocence.
**Left Side (Guilt):**
* **Motive:** V1 (0.9) influences Motive. Motive (0.3) and Opportunity (0.3) combine to form Circumstantial Evidence.
* **Opportunity:** D1 (0.1) influences Opportunity. W1 (0.2) influences Opportunity.
* **Circumstantial Evidence:** Positively influences Incultpatory Evidence.
* **Direct Evidence:** V2 (0.2) influences Direct Evidence. Direct Evidence positively influences Incultpatory Evidence.
* **Incultpatory Evidence:** Positively influences Innocence.
**Right Side (Innocence):**
* **Alibi:** E1 (0.3) influences Alibi. D2 (0.9) influences Alibi. Alibi positively influences Exculpatory Evidence.
* **Ability:** Ability positively influences Exculpatory Evidence.
* **Exculpatory Evidence:** Positively influences Innocence.
**Final Stage:**
* **Innocence:** Both Incultpatory Evidence and Exculpatory Evidence positively influence Innocence.
* **Max:** The "Max" label is positioned above the connection between Incultpatory Evidence and Exculpatory Evidence to Innocence.
**Numerical Values (Causal Link Strengths):**
* V1 -> Motive: 0.9
* D1 -> Opportunity: 0.1
* W1 -> Opportunity: 0.2
* V2 -> Direct Evidence: 0.2
* E1 -> Alibi: 0.3
* D2 -> Alibi: 0.9
* Motive + Opportunity -> Circumstantial Evidence: 0.3
* Circumstantial Evidence -> Incultpatory Evidence: +
* Direct Evidence -> Incultpatory Evidence: +
* Alibi -> Exculpatory Evidence: +
* Ability -> Exculpatory Evidence: +
* Incultpatory Evidence -> Innocence: +
* Exculpatory Evidence -> Innocence: +
### Key Observations
* The diagram highlights the interplay between different types of evidence in determining a conclusion of innocence or guilt.
* The strength of the causal links varies significantly. For example, V1 has a strong influence on Motive (0.9), while V2 has a weaker influence on Direct Evidence (0.2).
* The diagram suggests that both incriminating and exonerating evidence contribute to the overall assessment of innocence.
* The "Max" label suggests a point of culmination or maximum impact of the evidence on the final determination of innocence.
### Interpretation
This diagram represents a simplified model of how evidence is evaluated in a legal or investigative context. It demonstrates that establishing innocence or guilt is not a simple linear process but rather a complex interplay of various factors. The diagram suggests that a strong motive (V1) is a significant driver of the perception of guilt, while a strong alibi (D2) is a significant driver of the perception of innocence. The positive signs indicate that increasing the strength of incriminating or exonerating evidence will reinforce the corresponding conclusion. The diagram is a conceptual tool for understanding the dynamics of evidence and its impact on the determination of innocence. The numerical values provide a relative measure of the importance of each factor, but it's important to note that these values are likely subjective and based on assumptions. The diagram does not provide any factual data, but rather a theoretical framework for analyzing evidence.