## Chart: Correlation Amplitude vs. Order
### Overview
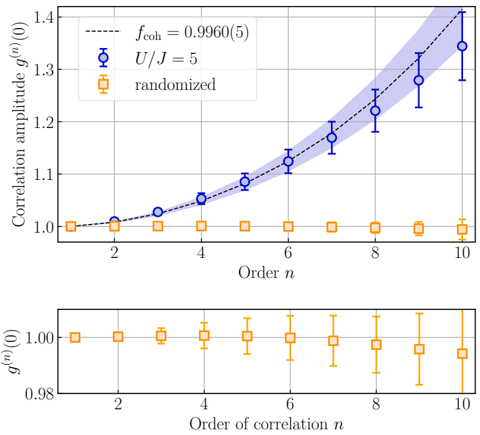
The image presents a chart comparing the correlation amplitude, g(n), as a function of the order 'n' for three different conditions: a coherent system (blue), a system with U/J = 5 (orange circles), and a randomized system (orange squares). The chart consists of two subplots, the top one showing the correlation amplitude for all three conditions, and the bottom one focusing on the randomized system with a zoomed-in y-axis.
### Components/Axes
* **X-axis (both plots):** "Order n" or "Order of correlation n". Scale ranges from approximately 1 to 10, with tick marks at integer values.
* **Y-axis (top plot):** "Correlation amplitude g(n)". Scale ranges from approximately 1.0 to 1.4, with tick marks at 0.2 intervals.
* **Y-axis (bottom plot):** "g(n)". Scale ranges from approximately 0.98 to 1.02, with tick marks at 0.02 intervals.
* **Legend (top-left):**
* Blue line with error bars: "f<sub>coh</sub> = 0.9960(5)"
* Orange circles with error bars: "U/J = 5"
* Orange squares with error bars: "randomized"
* **Grid:** A light gray grid is present on both plots, aiding in data point localization.
### Detailed Analysis or Content Details
**Top Plot:**
* **Blue Line (f<sub>coh</sub> = 0.9960(5)):** The blue line represents a coherent system. It exhibits a clear upward trend, indicating that the correlation amplitude increases with increasing order 'n'.
* n = 1: g(n) ≈ 1.08 ± 0.03
* n = 2: g(n) ≈ 1.12 ± 0.03
* n = 3: g(n) ≈ 1.16 ± 0.03
* n = 4: g(n) ≈ 1.20 ± 0.03
* n = 5: g(n) ≈ 1.24 ± 0.03
* n = 6: g(n) ≈ 1.28 ± 0.03
* n = 7: g(n) ≈ 1.32 ± 0.03
* n = 8: g(n) ≈ 1.36 ± 0.03
* n = 9: g(n) ≈ 1.40 ± 0.03
* n = 10: g(n) ≈ 1.44 ± 0.03
* **Orange Circles (U/J = 5):** The orange circles represent a system with U/J = 5. The data points are relatively flat, fluctuating around g(n) ≈ 1.0.
* n = 1: g(n) ≈ 1.03 ± 0.03
* n = 2: g(n) ≈ 1.01 ± 0.03
* n = 3: g(n) ≈ 1.02 ± 0.03
* n = 4: g(n) ≈ 1.03 ± 0.03
* n = 5: g(n) ≈ 1.01 ± 0.03
* n = 6: g(n) ≈ 1.01 ± 0.03
* n = 7: g(n) ≈ 1.02 ± 0.03
* n = 8: g(n) ≈ 1.01 ± 0.03
* n = 9: g(n) ≈ 1.02 ± 0.03
* n = 10: g(n) ≈ 1.00 ± 0.03
* **Orange Squares (randomized):** The orange squares represent a randomized system. The data points are also relatively flat, fluctuating around g(n) ≈ 1.0.
* n = 1: g(n) ≈ 1.01 ± 0.03
* n = 2: g(n) ≈ 0.99 ± 0.03
* n = 3: g(n) ≈ 1.01 ± 0.03
* n = 4: g(n) ≈ 1.00 ± 0.03
* n = 5: g(n) ≈ 1.00 ± 0.03
* n = 6: g(n) ≈ 1.01 ± 0.03
* n = 7: g(n) ≈ 1.00 ± 0.03
* n = 8: g(n) ≈ 1.01 ± 0.03
* n = 9: g(n) ≈ 1.00 ± 0.03
* n = 10: g(n) ≈ 1.00 ± 0.03
**Bottom Plot:**
* **Orange Squares (randomized):** This plot is a zoomed-in view of the randomized data from the top plot. The data points remain consistently around g(n) ≈ 1.0, with error bars indicating the uncertainty.
### Key Observations
* The coherent system (blue line) exhibits a strong positive correlation between correlation amplitude and order 'n'.
* Both the U/J = 5 system (orange circles) and the randomized system (orange squares) show minimal variation in correlation amplitude with respect to order 'n', remaining close to 1.0.
* The error bars on all data points indicate a degree of uncertainty in the measurements.
* The bottom plot confirms the flatness of the randomized system's correlation amplitude.
### Interpretation
The data suggests that the coherent system demonstrates a long-range correlation, as evidenced by the increasing correlation amplitude with increasing order 'n'. This indicates that elements in the system are strongly linked, even over larger distances. In contrast, the U/J = 5 system and the randomized system lack this long-range correlation, as their correlation amplitudes remain close to 1.0, indicating a lack of significant correlation beyond immediate neighbors. The randomized system, by definition, should exhibit minimal correlation, and the data confirms this. The U/J = 5 system, while not fully coherent, shows a slight tendency towards correlation, but it is not statistically significant given the error bars. The value f<sub>coh</sub> = 0.9960(5) likely represents a coherence factor for the coherent system, indicating a high degree of coherence. The error of (5) suggests the uncertainty in the coherence factor. The difference in behavior between the coherent system and the other two suggests that the coherence is a key factor in establishing long-range correlations within the system.