## Chart: Dual-Axis Capacity Factor Analysis
### Overview
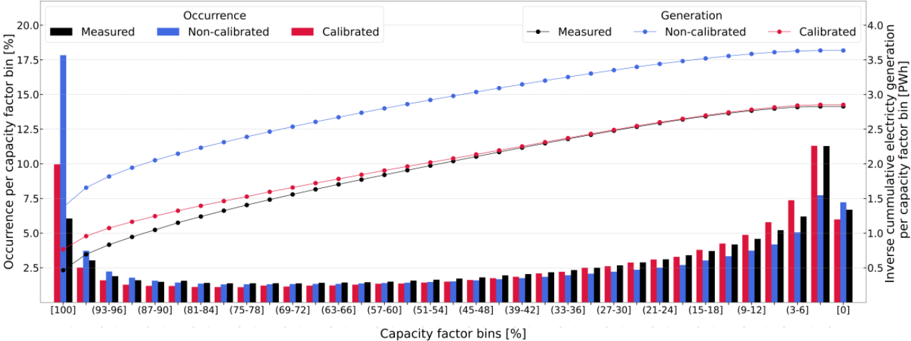
The image is a dual-axis chart comparing three data series (Measured, Non-calibrated, Calibrated) across capacity factor bins. The left y-axis represents "Occurrence per capacity factor bin [%]" (bars), while the right y-axis shows "Inverse cumulative capacity factor per bin [PWh]" (lines). The x-axis categorizes data into capacity factor bins (e.g., [100], [93-96], ..., [0]).
### Components/Axes
- **X-axis**: "Capacity factor bins [%]" with discrete bins (e.g., [100], [93-96], [87-90], ..., [0]).
- **Left Y-axis**: "Occurrence per capacity factor bin [%]" (bars).
- **Right Y-axis**: "Inverse cumulative capacity factor per bin [PWh]" (lines).
- **Legend**:
- **Black**: Measured
- **Blue**: Non-calibrated
- **Red**: Calibrated
- **Data Series**:
- **Bars** (left y-axis): Three categories (Measured, Non-calibrated, Calibrated).
- **Lines** (right y-axis): Three categories (Measured, Non-calibrated, Calibrated).
### Detailed Analysis
#### Left Y-Axis (Occurrence)
- **Measured (Black)**:
- Highest occurrence in [100] bin (~10%).
- Decreases sharply to ~2.5% in [93-96] bin.
- Remains low (~1-2%) in lower bins.
- **Non-calibrated (Blue)**:
- Lower than Measured in [100] (~7.5%).
- Slightly higher than Measured in [93-96] (~5%).
- Decreases to ~1-2% in lower bins.
- **Calibrated (Red)**:
- Lowest in [100] (~5%).
- Increases gradually to ~2.5% in [93-96].
- Remains low (~1-2%) in lower bins.
#### Right Y-Axis (Inverse Cumulative Generation)
- **Measured (Black Line)**:
- Starts at ~2.5 PWh in [100] bin.
- Increases gradually to ~3.5 PWh in [0] bin.
- **Non-calibrated (Blue Line)**:
- Starts at ~3.5 PWh in [100] bin.
- Increases steadily to ~4.0 PWh in [0] bin.
- **Calibrated (Red Line)**:
- Starts at ~2.5 PWh in [100] bin.
- Increases to ~3.0 PWh in [0] bin.
### Key Observations
1. **Occurrence Trends**:
- Measured data dominates the highest capacity factor bin ([100]).
- Non-calibrated and Calibrated show lower occurrence in high bins but similar trends in lower bins.
2. **Inverse Cumulative Generation**:
- Non-calibrated has the highest inverse cumulative generation across all bins.
- Measured and Calibrated show similar trends, with Calibrated slightly outperforming Measured in lower bins.
3. **Divergence**:
- Measured has the highest occurrence in [100] but the lowest inverse cumulative generation.
- Non-calibrated has the lowest occurrence in [100] but the highest inverse cumulative generation.
### Interpretation
The data suggests that **Non-calibrated models** prioritize higher capacity factors (e.g., [100] bin) for generation efficiency, as evidenced by their dominance in inverse cumulative generation. However, their occurrence in high-capacity bins is lower than Measured data, indicating potential trade-offs between occurrence and generation efficiency. **Calibrated models** balance these factors, showing moderate occurrence and generation performance. The **Measured data** reflects real-world distribution, with high occurrence in the [100] bin but lower cumulative generation, possibly due to operational constraints or measurement limitations. This analysis highlights the importance of calibration in optimizing capacity factor utilization for energy systems.