## Line Graph: Information Gain vs R² Value Over Training Steps
### Overview
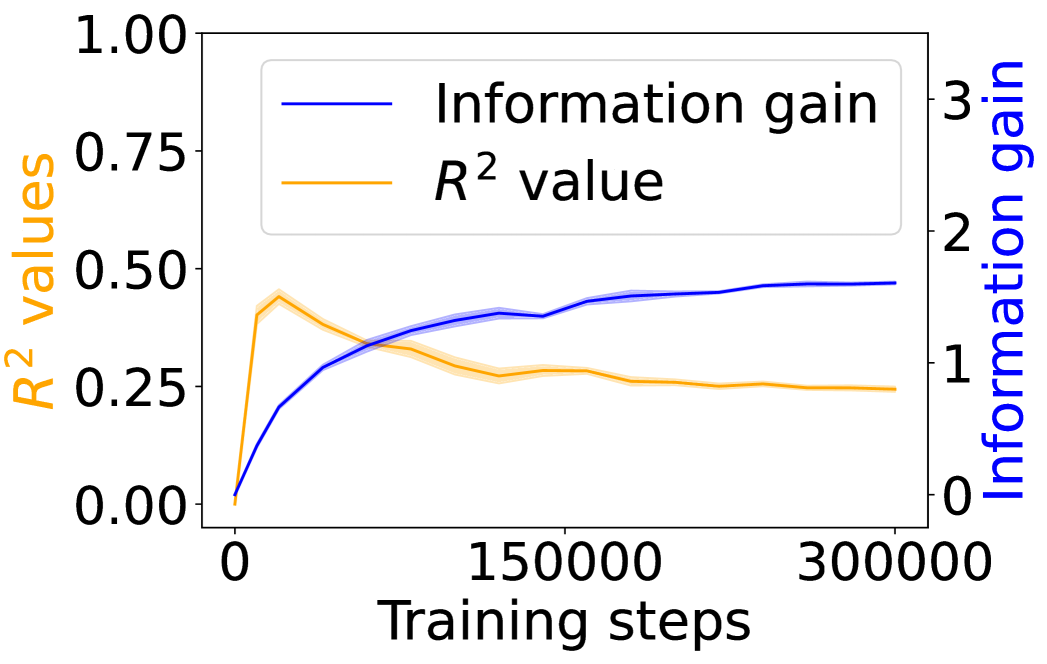
The graph depicts two metrics—**Information gain** (blue line) and **R² value** (orange line)—plotted against **Training steps** (x-axis). The left y-axis represents **R² values** (0–1), while the right y-axis represents **Information gain** (0–3). The legend is positioned in the top-left corner, with blue and orange lines corresponding to their respective metrics.
---
### Components/Axes
- **X-axis**: Training steps (0 to 300,000, linear scale).
- **Left Y-axis**: R² values (0 to 1, linear scale).
- **Right Y-axis**: Information gain (0 to 3, linear scale).
- **Legend**: Top-left corner, with blue = Information gain, orange = R² value.
---
### Detailed Analysis
#### R² Value (Orange Line)
- **Initial trend**: Starts near **0.4** at 0 training steps, peaks at **~0.45** around 50,000 steps, then declines steadily.
- **Final value**: Stabilizes at **~0.25** by 300,000 steps.
- **Visual trend**: Slopes downward after the initial peak, with minor fluctuations.
#### Information Gain (Blue Line)
- **Initial trend**: Begins near **0** at 0 training steps, rises sharply to **~2.5** by 300,000 steps.
- **Visual trend**: Consistently upward-sloping with no plateaus or declines.
#### Key Intersection
- The two lines intersect at **~50,000 training steps**, where R² (~0.45) and Information gain (~0.45) are approximately equal.
---
### Key Observations
1. **R² value decreases** over time, suggesting diminishing explanatory power of the model as training progresses.
2. **Information gain increases** monotonically, indicating growing utility or efficiency in the model’s outputs.
3. The divergence after 50,000 steps highlights a trade-off: higher information gain correlates with lower R² values.
---
### Interpretation
- **Model behavior**: The decline in R² may reflect overfitting or reduced generalization as the model becomes more specialized (higher information gain).
- **Practical implications**: While the model gains efficiency (information gain), its ability to explain variance in the data (R²) weakens, raising questions about long-term reliability.
- **Critical threshold**: The intersection at 50,000 steps suggests a potential optimal point for balancing these metrics, depending on the application’s priorities.
---
**Note**: All values are approximate, with uncertainty due to the graph’s resolution and lack of explicit error bars.