# Technical Data Extraction: Control Effect Analysis (Layer 1)
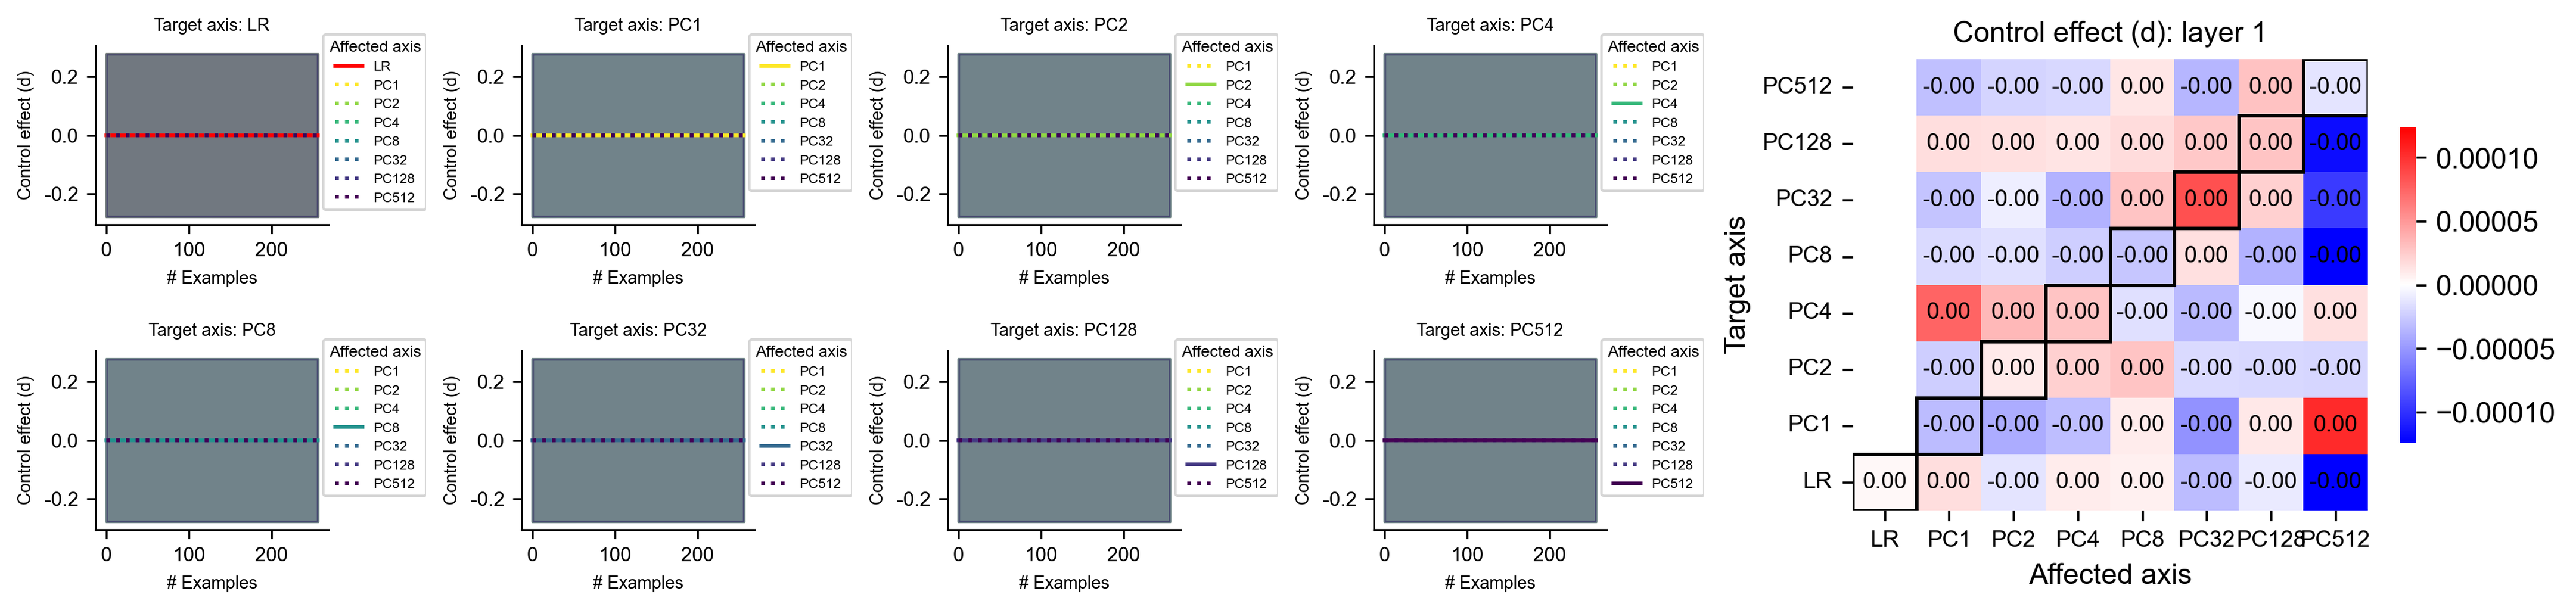
This document provides a comprehensive extraction of data and visual information from the provided image, which consists of eight line charts and one large heatmap analyzing "Control effect (d)" across various target and affected axes.
---
## 1. Component Isolation
The image is divided into two primary sections:
* **Left Section (Line Charts):** A 2x4 grid of line plots showing the control effect over time (# Examples).
* **Right Section (Heatmap):** A summary matrix titled "Control effect (d): layer 1" showing the relationship between Target and Affected axes.
---
## 2. Line Charts Analysis (Left Section)
### General Metadata for Line Charts
* **X-axis:** `# Examples` (Scale: 0 to 200+)
* **Y-axis:** `Control effect (d)` (Scale: -0.2 to 0.2)
* **Visual Trend:** In all eight plots, the data lines are horizontal and centered exactly at **0.0**. There is no deviation or slope observed across the number of examples.
* **Legend ("Affected axis"):** Contains the following categories with specific color/style coding:
* **LR:** Solid Red line
* **PC1:** Dotted Yellow line
* **PC2:** Dotted Light Green line
* **PC4:** Dotted Medium Green line
* **PC8:** Dotted Teal line
* **PC32:** Dotted Blue line
* **PC128:** Dotted Indigo line
* **PC512:** Dotted Purple line
### Individual Plot Details
Each plot represents a specific **Target axis**. In every plot, the line corresponding to the Target axis is highlighted as a solid line, while others remain dotted.
1. **Target axis: LR** (Top Row, 1st) - Solid red line at y=0.
2. **Target axis: PC1** (Top Row, 2nd) - Solid yellow line at y=0.
3. **Target axis: PC2** (Top Row, 3rd) - Solid light green line at y=0.
4. **Target axis: PC4** (Top Row, 4th) - Solid medium green line at y=0.
5. **Target axis: PC8** (Bottom Row, 1st) - Solid teal line at y=0.
6. **Target axis: PC32** (Bottom Row, 2nd) - Solid blue line at y=0.
7. **Target axis: PC128** (Bottom Row, 3rd) - Solid indigo line at y=0.
8. **Target axis: PC512** (Bottom Row, 4th) - Solid purple line at y=0.
---
## 3. Heatmap Analysis (Right Section)
**Title:** Control effect (d): layer 1
### Axis Labels
* **Y-axis (Target axis):** PC512, PC128, PC32, PC8, PC4, PC2, PC1, LR (Top to Bottom)
* **X-axis (Affected axis):** LR, PC1, PC2, PC4, PC8, PC32, PC128, PC512 (Left to Right)
### Color Scale (Legend)
* **Range:** -0.00010 (Deep Blue) to 0.00010 (Deep Red).
* **Center:** 0.00000 (White).
### Data Table Reconstruction
The heatmap contains numerical values. Note: "-0.00" indicates a very small negative value rounded to two decimal places. A black stepped border highlights the diagonal/near-diagonal relationship.
| Target \ Affected | LR | PC1 | PC2 | PC4 | PC8 | PC32 | PC128 | PC512 |
| :--- | :--- | :--- | :--- | :--- | :--- | :--- | :--- | :--- |
| **PC512** | -0.00 | -0.00 | -0.00 | 0.00 | -0.00 | 0.00 | -0.00 | |
| **PC128** | 0.00 | 0.00 | 0.00 | 0.00 | 0.00 | 0.00 | -0.00 | |
| **PC32** | -0.00 | -0.00 | -0.00 | 0.00 | 0.00 | 0.00 | -0.00 | |
| **PC8** | -0.00 | -0.00 | -0.00 | -0.00 | 0.00 | -0.00 | -0.00 | |
| **PC4** | 0.00 | 0.00 | 0.00 | -0.00 | -0.00 | -0.00 | 0.00 | |
| **PC2** | -0.00 | 0.00 | 0.00 | 0.00 | -0.00 | -0.00 | -0.00 | |
| **PC1** | | -0.00 | -0.00 | -0.00 | 0.00 | -0.00 | 0.00 | 0.00 |
| **LR** | 0.00 | 0.00 | -0.00 | 0.00 | 0.00 | -0.00 | -0.00 | -0.00 |
### Key Observations & Trends
1. **Magnitude:** The control effects are extremely small, as indicated by the color scale (orders of $10^{-5}$ or $10^{-4}$).
2. **Diagonal Pattern:** There is a distinct diagonal trend where the Target axis matches the Affected axis, though the values remain near zero.
3. **Specific Outliers:**
* **Target PC1 / Affected PC512:** Shows a strong positive (Red) effect (~0.00010).
* **Target LR / Affected PC512:** Shows a strong negative (Blue) effect (~ -0.00010).
* **Target PC128 / Affected PC512:** Shows a strong negative (Blue) effect.
* **Target PC32 / Affected PC32:** Shows a moderate positive (Red) effect.
4. **Symmetry:** The matrix is not perfectly symmetrical, suggesting directional influence from Target to Affected axes.