# Technical Document: Heatmap Analysis of Token Flip Rates
## 1. Axis Labels and Titles
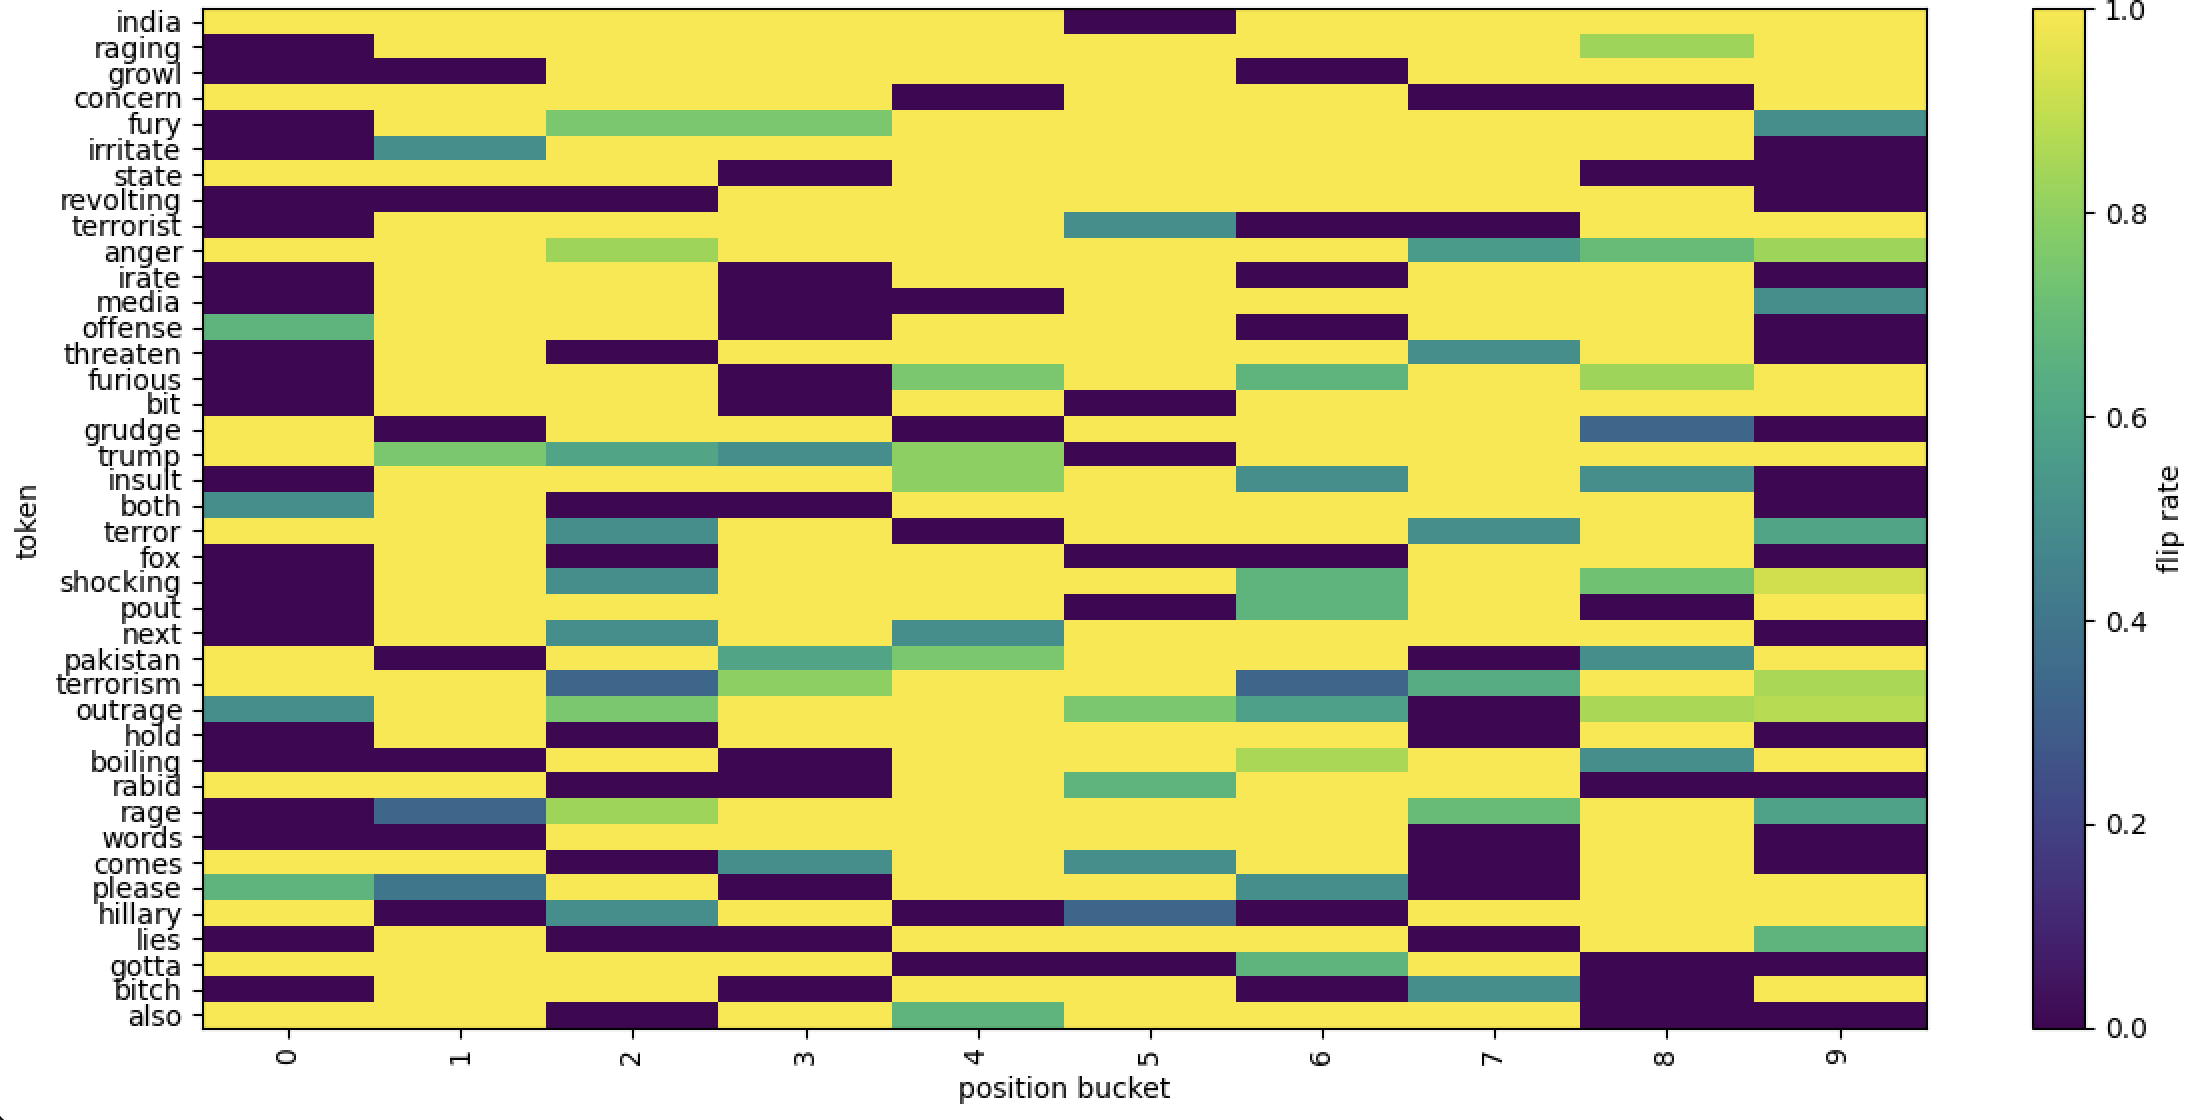
- **Y-Axis (Vertical)**: Labeled "token" with categorical data points representing individual words/phrases.
- **X-Axis (Horizontal)**: Labeled "position bucket" with numerical markers from 0 to 9.
- **Legend**: Located on the right side of the chart, titled "flip rate" with a color gradient from purple (0.0) to yellow (1.0).
## 2. Categories and Sub-Categories
### Y-Axis Tokens (Categories):
- india, raging, growl, concern, fury, irritate, state, revolting, terrorist, anger, irate, media, offense, threaten, furious, bit, grudge, trump, insult, both, terror, fox, shocking, pout, next, pakistan, terrorism, outrage, hold, boiling, rabid, rage, words, comes, please, hillary, lies, gotta, bitch, also.
### X-Axis Position Buckets (Sub-Categories):
- 0, 1, 2, 3, 4, 5, 6, 7, 8, 9.
## 3. Data Structure
The heatmap represents a **10xN matrix** where:
- **Rows**: Tokens (Y-axis categories).
- **Columns**: Position buckets (X-axis sub-categories).
- **Cells**: Color intensity indicating flip rate (0.0–1.0).
## 4. Key Trends and Observations
### Spatial Grounding of Legend
- The legend is positioned **vertically on the right side** of the chart, spanning the full height of the plot. Its color gradient aligns with the heatmap's color scale.
### Trend Verification
- **High Flip Rates (Yellow)**:
- "india" shows a strong yellow bar in position bucket 0.
- "rage" exhibits high flip rates in position buckets 2 and 5.
- "trump" has a yellow bar in position bucket 4.
- **Low Flip Rates (Purple)**:
- "bitch" has a dark purple bar in position bucket 8.
- "also" shows minimal flip rates across most buckets.
- **Moderate Flip Rates (Green/Blue)**:
- "media" and "terrorism" display green bars in position buckets 3 and 7, respectively.
- "both" and "shocking" have blue bars in position buckets 2 and 5.
### Component Isolation
- **Header**: Axis titles ("token" and "position bucket").
- **Main Chart**: Grid of colored cells representing flip rates.
- **Legend**: Color scale (0.0–1.0) with no numerical annotations.
## 5. Data Table Reconstruction
| Token | Position Bucket 0 | 1 | 2 | 3 | 4 | 5 | 6 | 7 | 8 | 9 |
|-------------|-------------------|---|---|---|---|---|---|---|---|---|
| india | Yellow | ... | ... | ... | ... | ... | ... | ... | ... | ... |
| raging | ... | Yellow | ... | ... | ... | ... | ... | ... | ... | ... |
| growl | ... | ... | ... | ... | ... | ... | ... | ... | ... | ... |
| ... | ... | ... | ... | ... | ... | ... | ... | ... | ... | ... |
| bitch | ... | ... | ... | ... | ... | ... | ... | ... | Purple | ... |
| also | ... | ... | ... | ... | ... | ... | ... | ... | ... | ... |
*Note: "..." indicates unspecified flip rates (color intensity varies).*
## 6. Color-Legend Cross-Reference
- **Purple (0.0)**: Minimal flip rate (e.g., "bitch" in position 8).
- **Yellow (1.0)**: Maximum flip rate (e.g., "india" in position 0).
- **Green/Blue (0.2–0.8)**: Intermediate flip rates (e.g., "media" in position 3).
## 7. Conclusion
The heatmap visualizes token-specific flip rates across 10 position buckets. High flip rates (yellow) are concentrated in specific tokens and positions, while low rates (purple) indicate infrequent flips. No numerical data is explicitly provided; trends are inferred from color intensity.