## Scatter Plot: Reasoning Tokens vs. Problem Size for qwen/qwq-32b-preview
### Overview
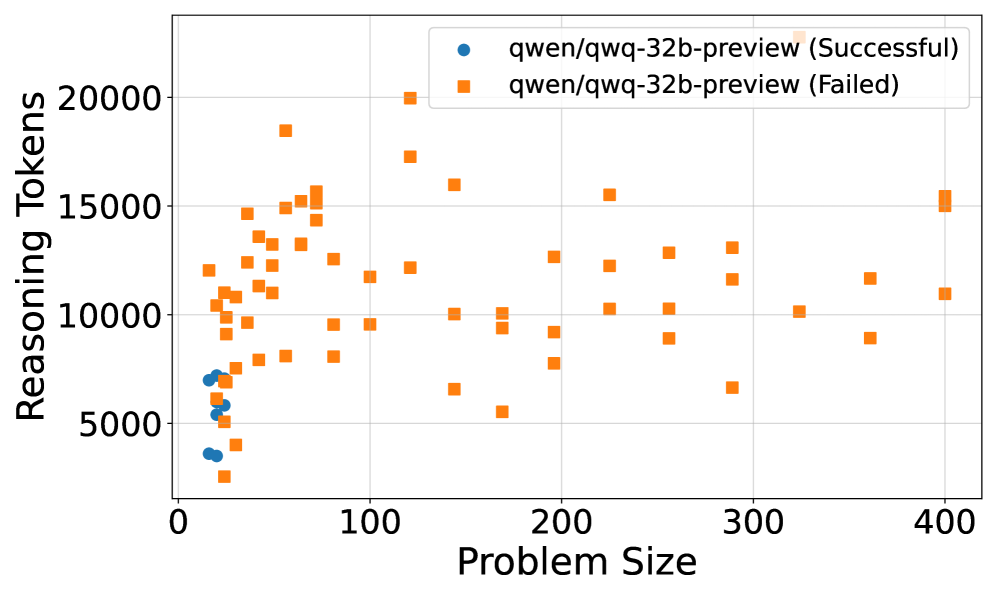
The image is a scatter plot showing the relationship between "Reasoning Tokens" and "Problem Size" for a model named "qwen/qwq-32b-preview". The plot distinguishes between successful and failed attempts using different markers: blue circles for successful attempts and orange squares for failed attempts.
### Components/Axes
* **X-axis (Horizontal):** "Problem Size". The scale ranges from 0 to 400, with tick marks at intervals of 100.
* **Y-axis (Vertical):** "Reasoning Tokens". The scale ranges from 0 to 20000, with tick marks at intervals of 5000.
* **Legend (Top-Right):**
* Blue Circle: "qwen/qwq-32b-preview (Successful)"
* Orange Square: "qwen/qwq-32b-preview (Failed)"
### Detailed Analysis
* **Successful Attempts (Blue Circles):**
* All successful attempts occur at small problem sizes, specifically below 50.
* Reasoning tokens for successful attempts range approximately from 3000 to 7000.
* The trend for successful attempts is that as problem size increases (from approximately 10 to 50), the reasoning tokens appear to increase slightly.
* Specific data points:
* Problem Size ~10, Reasoning Tokens ~3500
* Problem Size ~15, Reasoning Tokens ~5500
* Problem Size ~20, Reasoning Tokens ~5000
* Problem Size ~25, Reasoning Tokens ~7000
* Problem Size ~30, Reasoning Tokens ~6000
* **Failed Attempts (Orange Squares):**
* Failed attempts are scattered across the entire range of problem sizes (approximately 10 to 400).
* Reasoning tokens for failed attempts range approximately from 5000 to 20000.
* There is no clear trend between problem size and reasoning tokens for failed attempts. The data points appear randomly distributed.
* Specific data points:
* Problem Size ~10, Reasoning Tokens ~7000 to 16000
* Problem Size ~50, Reasoning Tokens ~8000 to 15000
* Problem Size ~100, Reasoning Tokens ~6000 to 18000
* Problem Size ~200, Reasoning Tokens ~6000 to 13000
* Problem Size ~300, Reasoning Tokens ~7000 to 13000
* Problem Size ~400, Reasoning Tokens ~12000 to 16000
### Key Observations
* The model "qwen/qwq-32b-preview" only succeeds on problems with small problem sizes (less than 50).
* The number of reasoning tokens required for successful attempts is significantly lower and more consistent than for failed attempts.
* Failed attempts show a wide range of reasoning tokens, regardless of problem size.
### Interpretation
The scatter plot suggests that the "qwen/qwq-32b-preview" model struggles with larger problem sizes. The successful attempts are clustered at low problem sizes, indicating a limitation in the model's ability to handle complex or large-scale reasoning tasks. The wide distribution of reasoning tokens for failed attempts suggests that the model's performance is inconsistent and unpredictable when it fails. The data implies that the model may require further optimization or a different approach to handle larger problem sizes effectively. The fact that successful attempts require fewer reasoning tokens could indicate that the model is more efficient when it can solve the problem, but struggles to find a solution for larger problems, leading to a higher and more variable token count.