## Bar Chart: Mean Accuracy by Category
### Overview
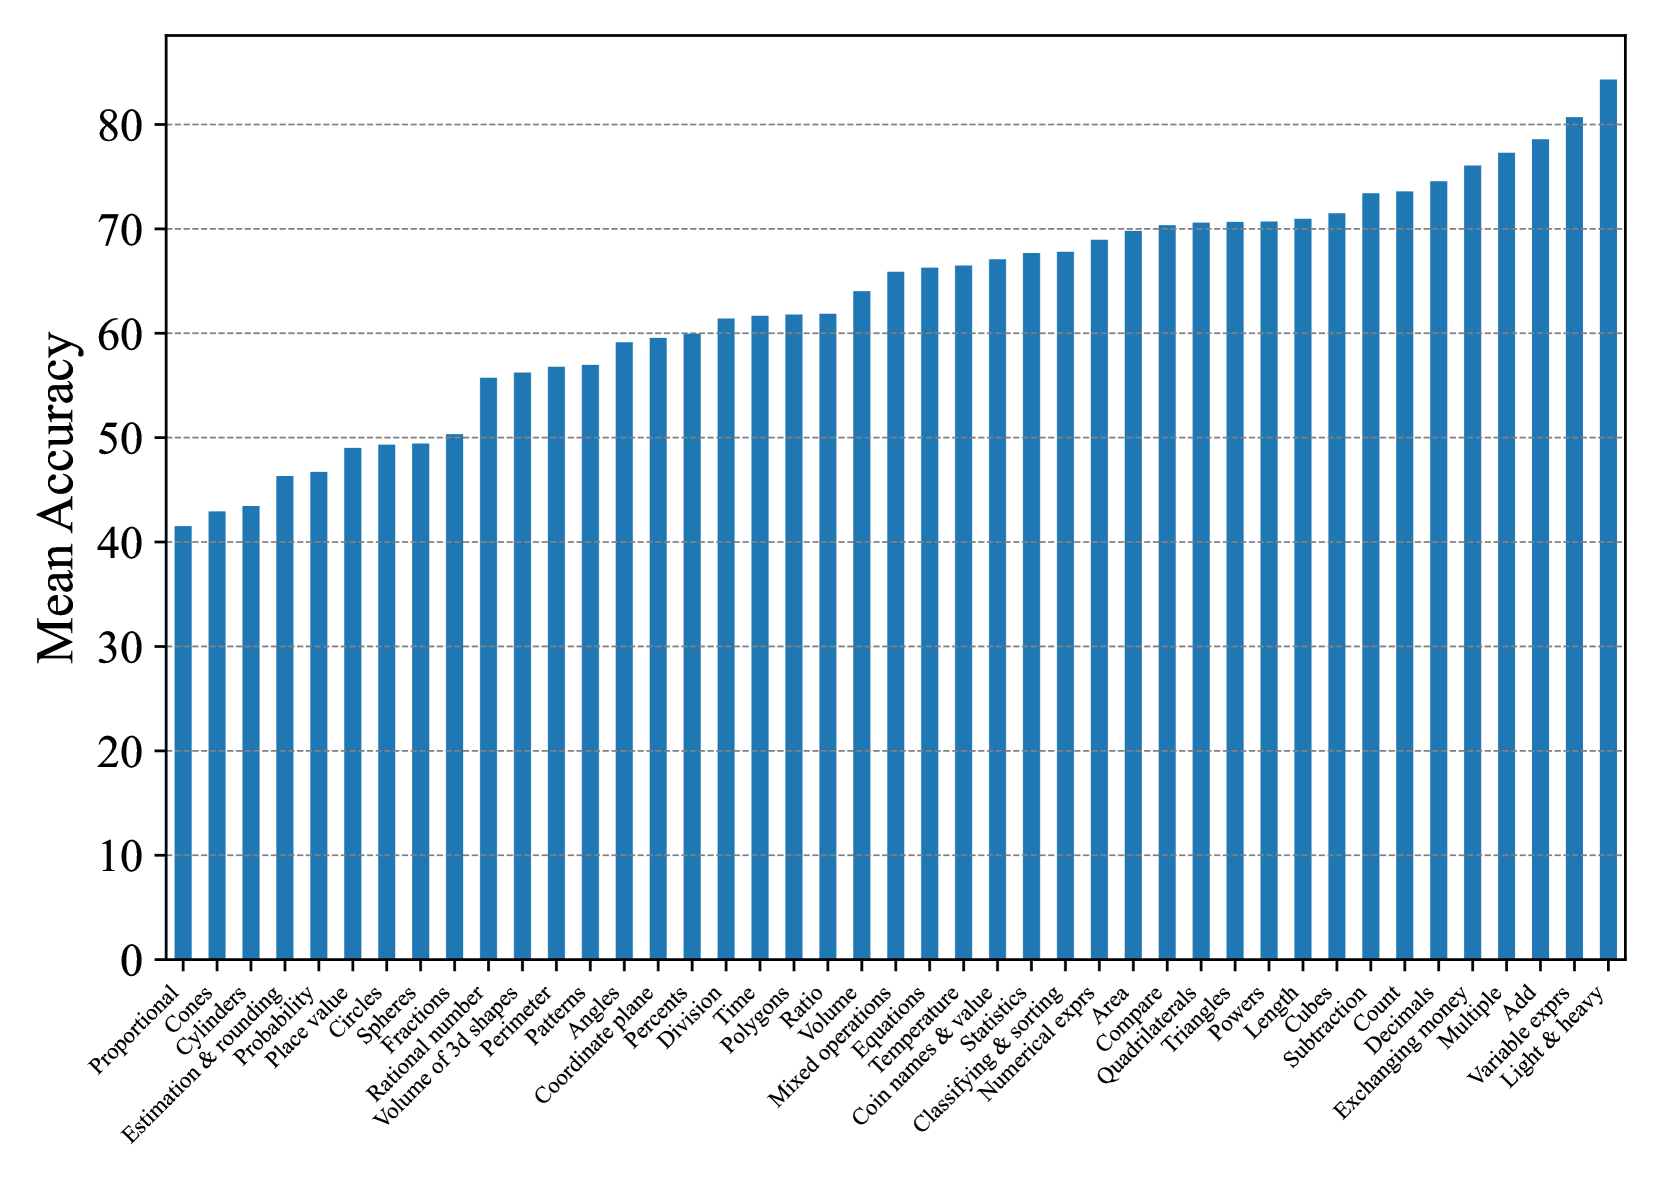
The image is a bar chart displaying the mean accuracy across various categories. The categories are listed along the x-axis, and the mean accuracy (ranging from 0 to 80) is represented on the y-axis. The bars are blue, and the categories are sorted by increasing mean accuracy.
### Components/Axes
* **Y-axis:** "Mean Accuracy", with a numerical scale from 0 to 80, incrementing by 10. Horizontal dashed gridlines are present at each increment of 10.
* **X-axis:** Categories, including "Proportional", "Cones", "Cylinders", "Estimation & rounding", "Probability", "Place value", "Circles", "Spheres", "Fractions", "Rational number", "Volume of 3d shapes", "Perimeter", "Patterns", "Angles", "Coordinate plane", "Percents", "Division", "Polygons", "Time", "Ratio", "Volume", "Mixed operations", "Equations", "Temperature", "Coin names & value", "Statistics", "Classifying & sorting", "Numerical exprs", "Area", "Compare", "Quadrilaterals", "Triangles", "Powers", "Length", "Cubes", "Subtraction", "Count", "Decimals", "Exchanging money", "Multiple", "Add", "Variable exprs", and "Light & heavy".
### Detailed Analysis
The bar chart shows the mean accuracy for each category. The categories are arranged in ascending order of accuracy.
* **Proportional:** Accuracy is approximately 41%.
* **Cones:** Accuracy is approximately 43%.
* **Cylinders:** Accuracy is approximately 43%.
* **Estimation & rounding:** Accuracy is approximately 46%.
* **Probability:** Accuracy is approximately 47%.
* **Place value:** Accuracy is approximately 49%.
* **Circles:** Accuracy is approximately 49%.
* **Spheres:** Accuracy is approximately 50%.
* **Fractions:** Accuracy is approximately 53%.
* **Rational number:** Accuracy is approximately 55%.
* **Volume of 3d shapes:** Accuracy is approximately 56%.
* **Perimeter:** Accuracy is approximately 56%.
* **Patterns:** Accuracy is approximately 58%.
* **Angles:** Accuracy is approximately 59%.
* **Coordinate plane:** Accuracy is approximately 59%.
* **Percents:** Accuracy is approximately 60%.
* **Division:** Accuracy is approximately 61%.
* **Polygons:** Accuracy is approximately 61%.
* **Time:** Accuracy is approximately 61%.
* **Ratio:** Accuracy is approximately 62%.
* **Volume:** Accuracy is approximately 62%.
* **Mixed operations:** Accuracy is approximately 65%.
* **Equations:** Accuracy is approximately 66%.
* **Temperature:** Accuracy is approximately 66%.
* **Coin names & value:** Accuracy is approximately 67%.
* **Statistics:** Accuracy is approximately 68%.
* **Classifying & sorting:** Accuracy is approximately 69%.
* **Numerical exprs:** Accuracy is approximately 70%.
* **Area:** Accuracy is approximately 70%.
* **Compare:** Accuracy is approximately 70%.
* **Quadrilaterals:** Accuracy is approximately 71%.
* **Triangles:** Accuracy is approximately 71%.
* **Powers:** Accuracy is approximately 71%.
* **Length:** Accuracy is approximately 72%.
* **Cubes:** Accuracy is approximately 73%.
* **Subtraction:** Accuracy is approximately 73%.
* **Count:** Accuracy is approximately 74%.
* **Decimals:** Accuracy is approximately 75%.
* **Exchanging money:** Accuracy is approximately 76%.
* **Multiple:** Accuracy is approximately 77%.
* **Add:** Accuracy is approximately 78%.
* **Variable exprs:** Accuracy is approximately 79%.
* **Light & heavy:** Accuracy is approximately 83%.
### Key Observations
* The mean accuracy varies significantly across categories, ranging from approximately 41% to 83%.
* The categories "Light & heavy", "Variable exprs", and "Add" have the highest mean accuracy.
* The categories "Proportional", "Cones", and "Cylinders" have the lowest mean accuracy.
* There is a general upward trend in mean accuracy as you move from left to right along the x-axis.
### Interpretation
The bar chart provides a visual representation of the relative difficulty or understanding of different mathematical and conceptual categories. The categories with higher mean accuracy suggest that individuals perform better in those areas, while categories with lower mean accuracy may indicate areas where individuals struggle more. The data could be used to identify areas where additional focus or instruction is needed to improve overall understanding and performance. The wide range of accuracy scores suggests that some concepts are significantly easier or more intuitive than others.