## Diagram: Tree Diagrams with Redirection
### Overview
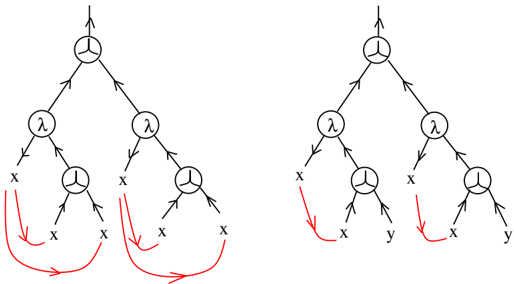
The image presents two tree diagrams, each depicting a hierarchical structure with nodes and directed edges. The diagrams are similar but differ in the final nodes and the redirection of edges indicated by red arrows. The nodes are labeled with symbols and variables.
### Components/Axes
* **Nodes:** Circular nodes containing symbols. The symbols are either "λ" (lambda) or a symbol resembling a trident inside a circle.
* **Edges:** Directed edges (arrows) connecting the nodes, indicating the flow or relationship between them.
* **Variables:** The terminal nodes are labeled with variables "x" and "y".
* **Redirection Arrows:** Red arrows indicate a redirection or mapping from one terminal node to another.
### Detailed Analysis
**Left Diagram:**
* **Top Node:** A circular node with the trident symbol.
* **Second Level:** Two nodes, each labeled with "λ".
* **Third Level:** Two nodes, each with the trident symbol.
* **Terminal Nodes:** Each trident node splits into two terminal nodes labeled "x".
* **Redirection:** A red arrow originates from the leftmost "x" and curves to point to the second "x" from the left. Another red arrow originates from the third "x" from the left and curves to point to the rightmost "x".
**Right Diagram:**
* **Top Node:** A circular node with the trident symbol.
* **Second Level:** Two nodes, each labeled with "λ".
* **Third Level:** Two nodes, each with the trident symbol.
* **Terminal Nodes:** The left trident node splits into "x" and "y". The right trident node splits into "x" and "y".
* **Redirection:** A red arrow originates from the leftmost "x" and curves to point to the "x" on the right side. Another red arrow originates from the "y" on the left side and curves to point to the "y" on the right side.
### Key Observations
* Both diagrams share the same initial structure, diverging only at the terminal nodes and redirection arrows.
* The left diagram maps "x" to "x", while the right diagram maps "x" to "x" and "y" to "y".
### Interpretation
The diagrams likely represent some form of transformation or mapping process. The "λ" nodes might represent lambda abstractions, and the trident nodes could represent function applications or other operations. The red arrows indicate a specific mapping or substitution rule. The left diagram shows a mapping where all terminal nodes are "x" and are redirected to each other. The right diagram shows a mapping where "x" maps to "x" and "y" maps to "y", suggesting an identity-like transformation for these variables. The diagrams could be related to lambda calculus, type theory, or other formal systems where such transformations are common.