\n
## Bar Chart: Overall Accuracy Comparison
### Overview
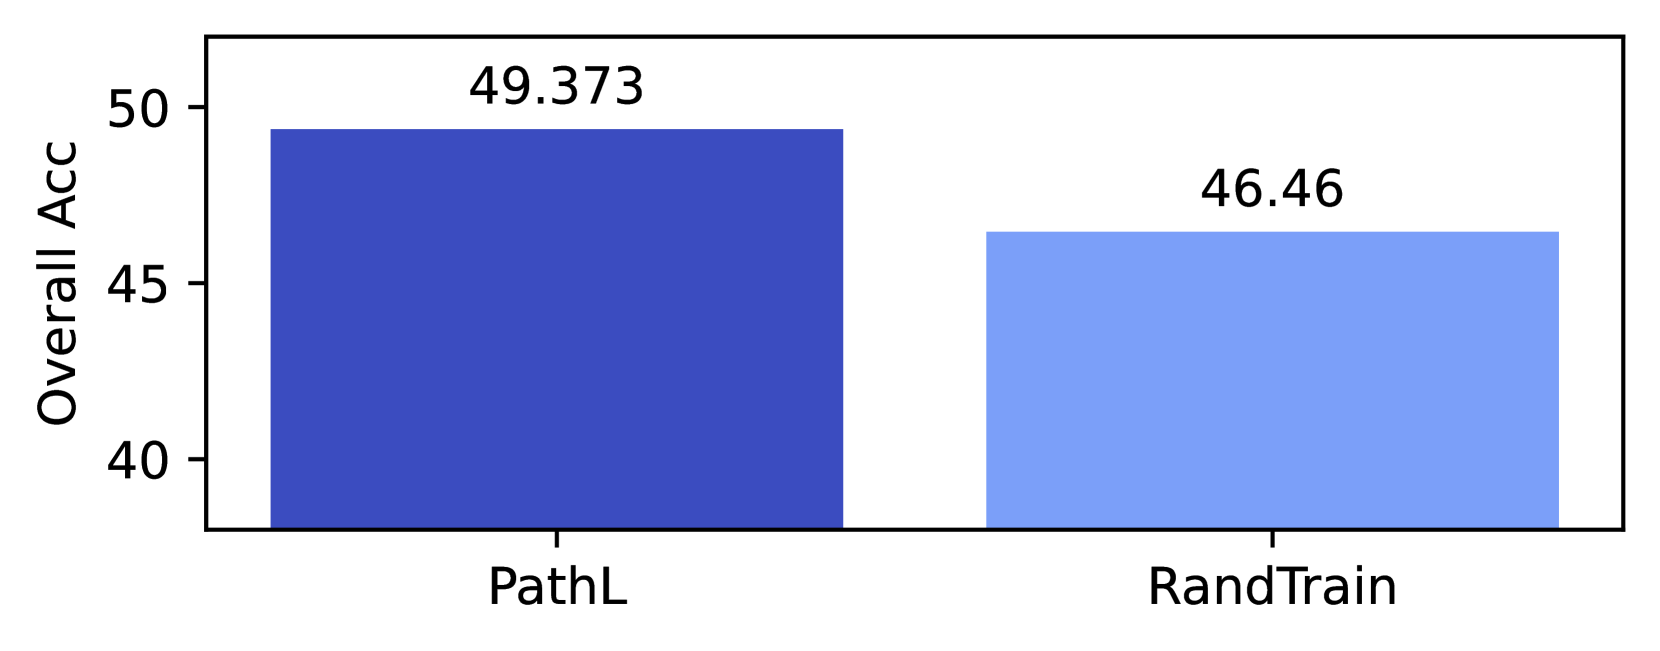
The image displays a simple vertical bar chart comparing the "Overall Acc" (Overall Accuracy) of two distinct methods or models, labeled "PathL" and "RandTrain". The chart presents a direct performance comparison, with numerical values annotated above each bar.
### Components/Axes
* **Chart Type:** Vertical Bar Chart.
* **Y-Axis:**
* **Label:** "Overall Acc" (written vertically along the left side).
* **Scale:** Linear scale ranging from 40 to 50.
* **Major Ticks:** Marked at intervals of 5 (40, 45, 50).
* **X-Axis:**
* **Categories:** Two categorical bars.
* **Category Labels:** "PathL" (left bar) and "RandTrain" (right bar).
* **Data Series & Values:**
* **PathL:** Represented by a dark blue bar. The exact value annotated above the bar is **49.373**.
* **RandTrain:** Represented by a light blue bar. The exact value annotated above the bar is **46.46**.
* **Legend:** No separate legend is present. The categories are identified solely by their x-axis labels and distinct bar colors.
* **Title:** No chart title is visible in the image.
### Detailed Analysis
* **Spatial Grounding & Color Confirmation:** The left bar, positioned above the "PathL" label, is colored dark blue and corresponds to the value 49.373. The right bar, positioned above the "RandTrain" label, is colored light blue and corresponds to the value 46.46.
* **Trend Verification:** The chart shows a direct comparison, not a time-series trend. The visual trend is that the "PathL" bar is taller than the "RandTrain" bar, indicating a higher value.
* **Data Points:**
* PathL: 49.373
* RandTrain: 46.46
* **Derived Difference:** The absolute difference in Overall Accuracy between PathL and RandTrain is approximately **2.913** (49.373 - 46.46).
### Key Observations
1. **Performance Gap:** The "PathL" method demonstrates a higher Overall Accuracy than the "RandTrain" method.
2. **Precision of Reporting:** The values are reported to two and three decimal places (46.46 and 49.373, respectively), suggesting the measurements or calculations were performed with high precision.
3. **Scale Focus:** The y-axis starts at 40, not 0. This visual choice emphasizes the difference between the two values but does not distort the relative comparison since both bars are measured against the same baseline.
### Interpretation
The data suggests that the "PathL" approach is more effective, as measured by "Overall Acc," than the "RandTrain" approach for the given task or dataset. The difference of nearly 3 percentage points is likely significant in a machine learning or statistical modeling context, where small improvements in accuracy can be meaningful.
Without additional context (e.g., what "PathL" and "RandTrain" specifically refer to, the nature of the task, or the dataset), the interpretation is limited to this relative performance comparison. "RandTrain" may imply a randomized training baseline, while "PathL" could refer to a method incorporating path-based learning or logic. The chart's primary message is the superiority of PathL over this particular baseline in terms of the reported accuracy metric.