## Multi-Plot Chart: Analysis of Cross-Entropy, Path-Entropy, MFPT, WHR, and Rationality Minima
### Overview
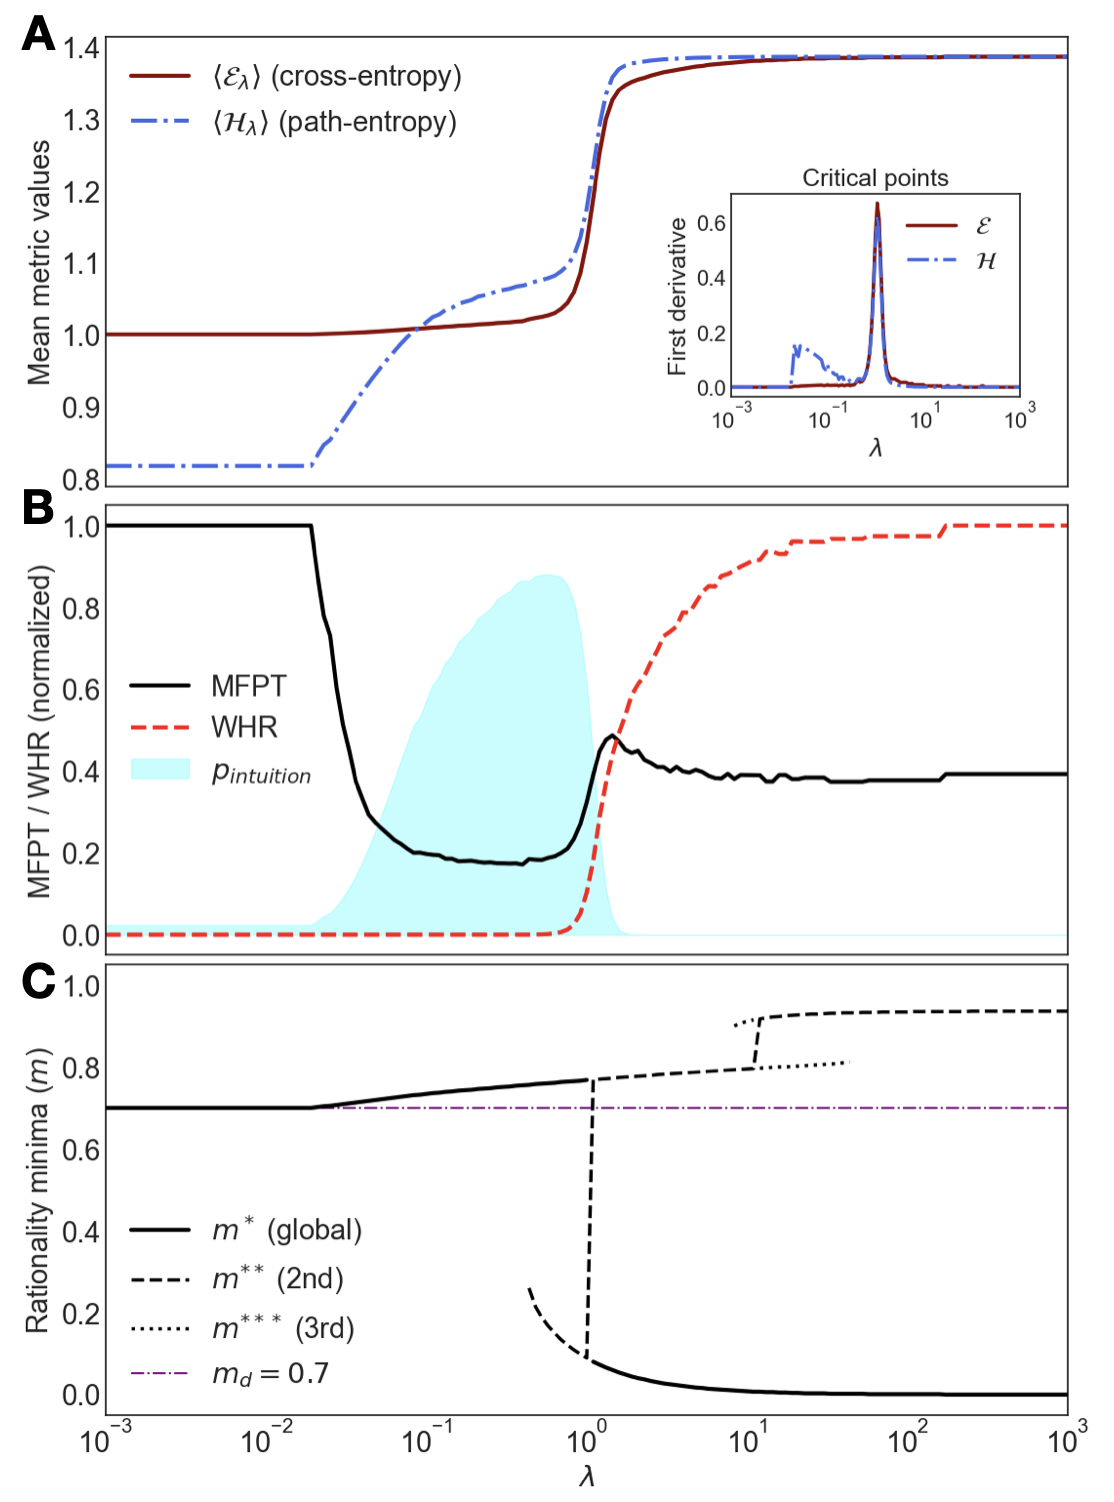
The image presents three plots (A, B, and C) that analyze different metrics related to a system's behavior as a function of a parameter lambda (λ). Plot A shows the mean metric values of cross-entropy and path-entropy. Plot B displays the normalized MFPT (Mean First Passage Time) and WHR (Waiting Hit Rate), along with a shaded region representing intuition. Plot C illustrates the rationality minima. An inset in Plot A shows the first derivative of cross-entropy and path-entropy.
### Components/Axes
**Plot A:**
* **Title:** Mean metric values
* **Y-axis:** Mean metric values, ranging from 0.8 to 1.4
* **X-axis:** Lambda (λ), implied to be logarithmic based on other plots.
* **Legend (Top-Left):**
* `<ελ> (cross-entropy)`: Solid brown line
* `<Hλ> (path-entropy)`: Dashed blue line
* **Inset Plot (Top-Right):**
* **Title:** Critical points
* **Y-axis:** First derivative, ranging from 0.0 to 0.6
* **X-axis:** Lambda (λ), ranging from 10^-3 to 10^3
* **Legend:**
* `ε`: Solid brown line
* `H`: Dashed blue line
**Plot B:**
* **Title:** MFPT / WHR (normalized)
* **Y-axis:** MFPT / WHR (normalized), ranging from 0.0 to 1.0
* **X-axis:** Lambda (λ), ranging from 10^-3 to 10^3 (logarithmic scale)
* **Legend (Left):**
* `MFPT`: Solid black line
* `WHR`: Dashed red line
* `p_intuition`: Light blue shaded area
**Plot C:**
* **Title:** Rationality minima (m)
* **Y-axis:** Rationality minima (m), ranging from 0.0 to 1.0
* **X-axis:** Lambda (λ), ranging from 10^-3 to 10^3 (logarithmic scale)
* **Legend (Left):**
* `m* (global)`: Solid black line
* `m** (2nd)`: Dashed black line
* `m*** (3rd)`: Dotted black line
* `md = 0.7`: Dashed-dotted purple line
### Detailed Analysis
**Plot A:**
* **`<ελ> (cross-entropy)` (Solid brown line):** Starts at approximately 1.0 for λ < 0.1, remains relatively constant until λ ≈ 1, then increases sharply to approximately 1.38, and plateaus.
* **`<Hλ> (path-entropy)` (Dashed blue line):** Starts at approximately 0.8 for λ < 0.1, increases gradually until λ ≈ 1, then increases sharply to approximately 1.38, and plateaus.
* **Inset Plot:** Shows the first derivative of cross-entropy and path-entropy. Both derivatives peak around λ ≈ 1, indicating a critical point where the rate of change is highest.
**Plot B:**
* **`MFPT` (Solid black line):** Starts at 1.0 for λ < 0.1, decreases to approximately 0.2 around λ ≈ 1, then increases to approximately 0.4 and plateaus.
* **`WHR` (Dashed red line):** Starts at 0.0 for λ < 0.1, remains at 0 until λ ≈ 1, then increases to approximately 0.9 and plateaus.
* **`p_intuition` (Light blue shaded area):** Forms a bell-shaped curve centered around λ ≈ 0.1, indicating a region where intuition is most prominent.
**Plot C:**
* **`m* (global)` (Solid black line):** Starts at approximately 0.7 for λ < 1, then decreases sharply to approximately 0.0 for λ > 1, and plateaus.
* **`m** (2nd)` (Dashed black line):** Starts at approximately 0.7 for λ < 1, then increases sharply to approximately 0.8 for λ > 1, and plateaus.
* **`m*** (3rd)` (Dotted black line):** Starts at approximately 0.7 for λ < 10, then increases sharply to approximately 0.85 for λ > 10, and plateaus.
* **`md = 0.7` (Dashed-dotted purple line):** Remains constant at 0.7 across all values of λ.
### Key Observations
* **Critical Point:** All plots show a significant change in behavior around λ ≈ 1, suggesting a critical point in the system's dynamics.
* **Entropy Transition:** In Plot A, both cross-entropy and path-entropy increase sharply around λ ≈ 1, indicating a transition in the system's entropy characteristics.
* **MFPT/WHR Trade-off:** In Plot B, MFPT decreases while WHR increases around λ ≈ 1, suggesting a trade-off between the time it takes to reach a state and the frequency of hitting that state.
* **Intuition Peak:** The `p_intuition` curve in Plot B peaks around λ ≈ 0.1, indicating that intuition plays a significant role in this region.
* **Rationality Shift:** In Plot C, the rationality minima shift around λ ≈ 1, suggesting a change in the system's rationality characteristics.
### Interpretation
The plots collectively suggest a system undergoing a phase transition or a significant change in its dynamics around λ ≈ 1. Before this point, the system exhibits different characteristics in terms of entropy, time to reach a state, frequency of hitting a state, and rationality. The peak in intuition around λ ≈ 0.1 suggests that intuitive decision-making is more prevalent in this region. The sharp changes in entropy, MFPT, WHR, and rationality minima around λ ≈ 1 indicate a shift in the system's behavior, potentially driven by a change in the underlying mechanisms or parameters. The constant `md = 0.7` line in Plot C may represent a baseline or threshold for rationality.