## Bar Chart: Prediction Flip Rate Comparison for Mistral-7B Models
### Overview
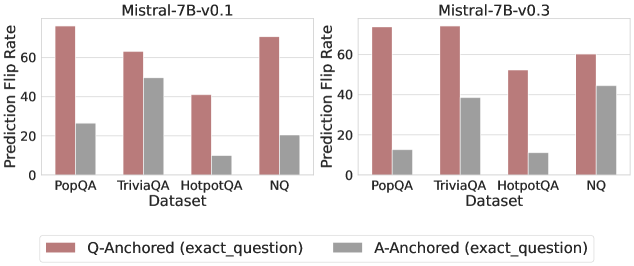
The image presents two bar charts comparing the prediction flip rates of Mistral-7B-v0.1 and Mistral-7B-v0.3 models across four datasets: PopQA, TriviaQA, HotpotQA, and NQ. The charts show the prediction flip rates for both Q-Anchored (exact_question) and A-Anchored (exact_question) scenarios.
### Components/Axes
* **Title (Top-Left Chart):** Mistral-7B-v0.1
* **Title (Top-Right Chart):** Mistral-7B-v0.3
* **Y-Axis Label:** Prediction Flip Rate
* **Y-Axis Scale:** 0 to 80, with tick marks at 0, 20, 40, 60
* **X-Axis Label:** Dataset
* **X-Axis Categories:** PopQA, TriviaQA, HotpotQA, NQ
* **Legend (Bottom):**
* Q-Anchored (exact\_question) - Brown
* A-Anchored (exact\_question) - Gray
### Detailed Analysis
**Left Chart: Mistral-7B-v0.1**
* **PopQA:**
* Q-Anchored (Brown): Approximately 73%
* A-Anchored (Gray): Approximately 26%
* **TriviaQA:**
* Q-Anchored (Brown): Approximately 62%
* A-Anchored (Gray): Approximately 50%
* **HotpotQA:**
* Q-Anchored (Brown): Approximately 41%
* A-Anchored (Gray): Approximately 10%
* **NQ:**
* Q-Anchored (Brown): Approximately 68%
* A-Anchored (Gray): Approximately 23%
**Right Chart: Mistral-7B-v0.3**
* **PopQA:**
* Q-Anchored (Brown): Approximately 75%
* A-Anchored (Gray): Approximately 12%
* **TriviaQA:**
* Q-Anchored (Brown): Approximately 75%
* A-Anchored (Gray): Approximately 38%
* **HotpotQA:**
* Q-Anchored (Brown): Approximately 52%
* A-Anchored (Gray): Approximately 12%
* **NQ:**
* Q-Anchored (Brown): Approximately 60%
* A-Anchored (Gray): Approximately 43%
### Key Observations
* In both charts, the Q-Anchored prediction flip rates are consistently higher than the A-Anchored rates across all datasets.
* The Mistral-7B-v0.3 model generally shows a higher Q-Anchored prediction flip rate for TriviaQA and HotpotQA compared to Mistral-7B-v0.1.
* The A-Anchored prediction flip rates vary across datasets and models, with TriviaQA showing the highest rate for Mistral-7B-v0.1 and NQ showing the highest rate for Mistral-7B-v0.3.
### Interpretation
The data suggests that the prediction flip rate is significantly influenced by whether the question or the answer is anchored. The higher flip rates for Q-Anchored scenarios indicate that the model's predictions are more sensitive to changes in the question. The differences between Mistral-7B-v0.1 and Mistral-7B-v0.3 highlight the impact of model version on prediction stability. The variations across datasets suggest that the complexity and nature of the questions in each dataset also play a role in the prediction flip rate. The lower A-Anchored rates suggest that the model is more robust to changes in the answer, possibly because the answer provides a stronger contextual anchor.