## Line Chart: Accuracy vs. Thoughts per Step
### Overview
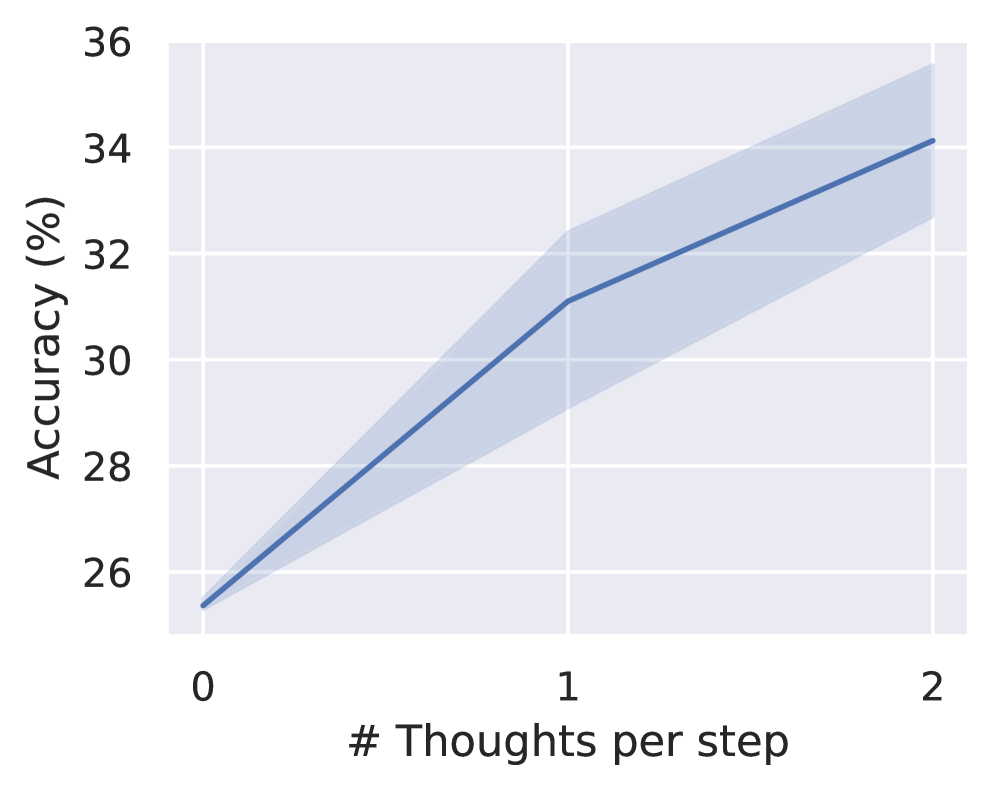
The image is a line chart showing the relationship between "Accuracy (%)" and "# Thoughts per step". The chart displays a generally increasing trend in accuracy as the number of thoughts per step increases. A shaded region around the line indicates variability or uncertainty.
### Components/Axes
* **X-axis:** "# Thoughts per step" with markers at 0, 1, and 2.
* **Y-axis:** "Accuracy (%)" with markers at 26, 28, 30, 32, 34, and 36.
* **Data Series:** A single blue line representing the accuracy at different numbers of thoughts per step. A shaded blue region surrounds the line, indicating a confidence interval or standard deviation.
### Detailed Analysis
* **Trend:** The blue line shows an upward trend, indicating that accuracy increases as the number of thoughts per step increases.
* **Data Points:**
* At 0 thoughts per step, the accuracy is approximately 25.4%.
* At 1 thought per step, the accuracy is approximately 31.2%.
* At 2 thoughts per step, the accuracy is approximately 34.1%.
* **Uncertainty:** The shaded region around the line widens as the number of thoughts per step increases, suggesting greater variability or uncertainty in accuracy at higher numbers of thoughts.
### Key Observations
* The accuracy increases noticeably from 0 to 1 thought per step, and then increases at a slower rate from 1 to 2 thoughts per step.
* The uncertainty in accuracy is relatively small at 0 thoughts per step but increases significantly at 1 and 2 thoughts per step.
### Interpretation
The chart suggests that increasing the number of thoughts per step generally improves accuracy. However, the diminishing returns and increasing uncertainty at higher numbers of thoughts per step indicate that there may be a point beyond which further increases in thoughts per step do not significantly improve accuracy and may even introduce more variability. The shaded region likely represents the standard deviation or confidence interval, showing the range of possible accuracy values for each number of thoughts per step. This could be due to the complexity of the task, the variability in the quality of thoughts, or other factors.