## Scatter Plot: Reasoning Tokens vs. Problem Size
### Overview
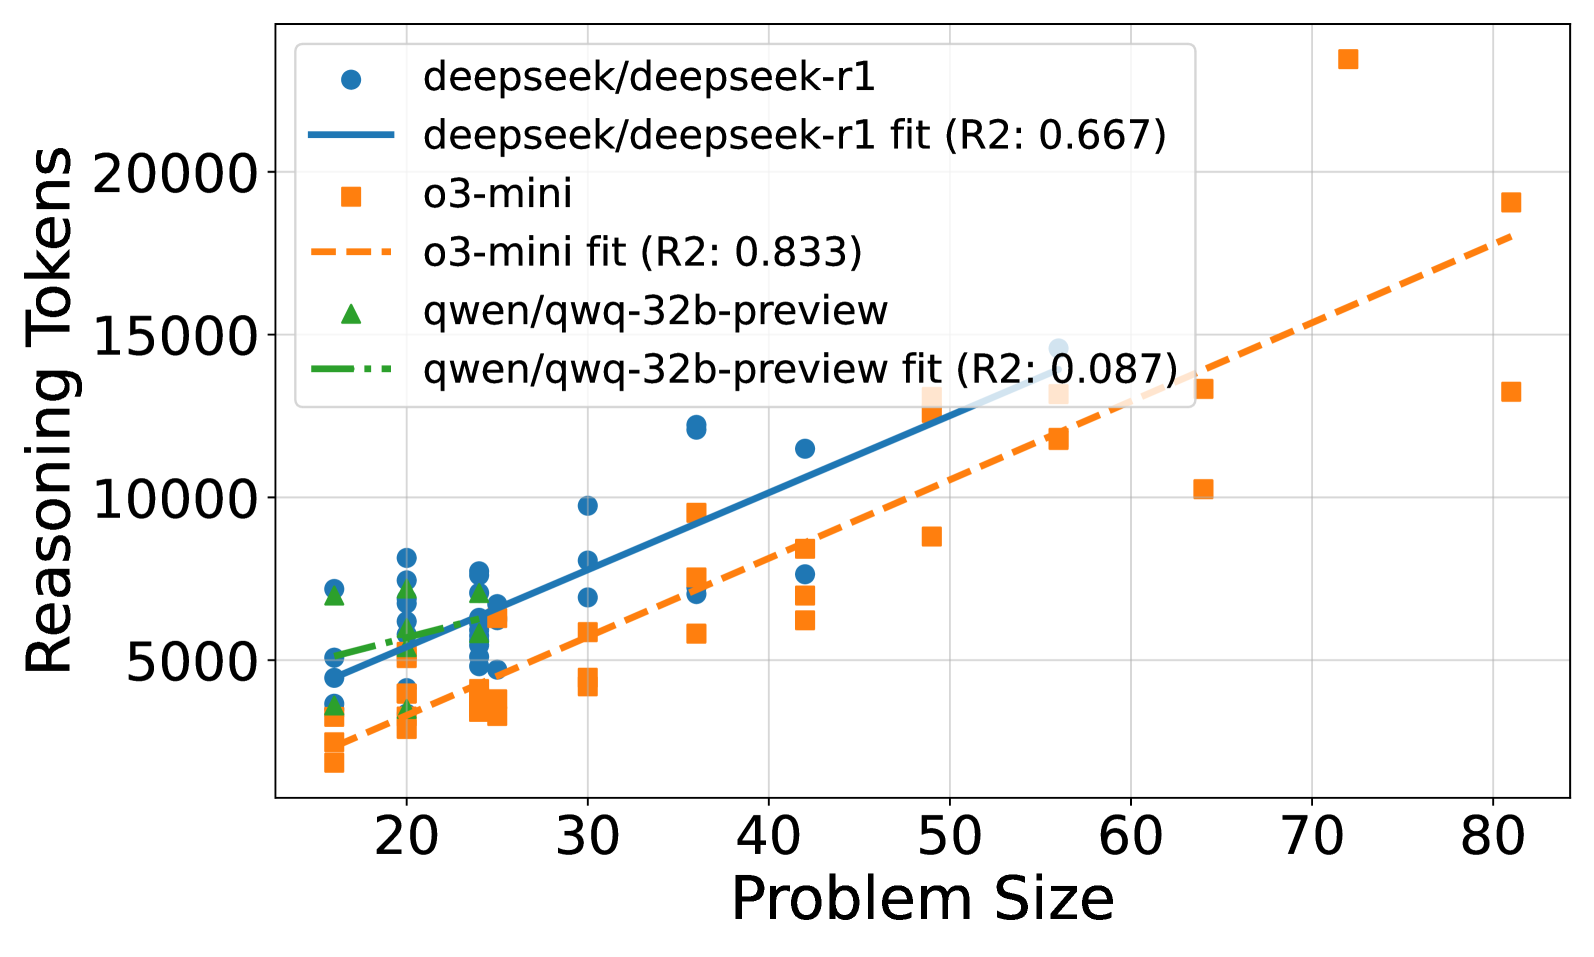
The image is a scatter plot comparing the number of reasoning tokens used by three different models (deepseek/deepseek-r1, o3-mini, and qwen/qwq-32b-preview) against the problem size. Each model has a scatter plot of data points and a fitted line, along with an R-squared value indicating the goodness of fit.
### Components/Axes
* **X-axis:** Problem Size, ranging from approximately 15 to 80 in increments of 10.
* **Y-axis:** Reasoning Tokens, ranging from 0 to 20000 in increments of 5000.
* **Legend (Top-Right):**
* Blue Circle: deepseek/deepseek-r1
* Blue Line: deepseek/deepseek-r1 fit (R2: 0.667)
* Orange Square: o3-mini
* Orange Dashed Line: o3-mini fit (R2: 0.833)
* Green Triangle: qwen/qwq-32b-preview
* Green Dash-Dot Line: qwen/qwq-32b-preview fit (R2: 0.087)
### Detailed Analysis
* **deepseek/deepseek-r1 (Blue):**
* Trend: The number of reasoning tokens generally increases with problem size.
* Data Points: At problem size ~20, reasoning tokens are around 4000-7000. At problem size ~40, reasoning tokens are around 7000-12000.
* Fitted Line: The blue line shows a positive slope.
* R-squared: 0.667
* **o3-mini (Orange):**
* Trend: The number of reasoning tokens increases with problem size.
* Data Points: At problem size ~20, reasoning tokens are around 2000-4000. At problem size ~80, reasoning tokens are around 13000-19000.
* Fitted Line: The orange dashed line shows a positive slope, steeper than deepseek/deepseek-r1.
* R-squared: 0.833
* **qwen/qwq-32b-preview (Green):**
* Trend: The number of reasoning tokens remains relatively constant with increasing problem size.
* Data Points: Reasoning tokens are clustered around 5000-7000 for problem sizes between 15 and 30.
* Fitted Line: The green dash-dot line is nearly flat.
* R-squared: 0.087
### Key Observations
* The o3-mini model has the highest R-squared value (0.833), indicating the best fit to its data.
* The qwen/qwq-32b-preview model has a very low R-squared value (0.087), suggesting a poor fit and that problem size does not strongly predict reasoning tokens for this model.
* For smaller problem sizes (around 20), o3-mini uses the fewest reasoning tokens, while qwen/qwq-32b-preview and deepseek/deepseek-r1 use a similar number of tokens.
* For larger problem sizes (around 80), o3-mini uses significantly more reasoning tokens than deepseek/deepseek-r1.
### Interpretation
The scatter plot illustrates the relationship between problem size and the number of reasoning tokens used by different models. The R-squared values indicate how well the fitted lines represent the data. The o3-mini model shows a strong positive correlation between problem size and reasoning tokens, while the qwen/qwq-32b-preview model shows almost no correlation. The deepseek/deepseek-r1 model shows a moderate positive correlation. This suggests that the o3-mini model's token usage is highly dependent on problem size, while the qwen/qwq-32b-preview model's token usage is relatively independent of problem size within the range tested. The deepseek/deepseek-r1 model falls in between these two extremes. The data suggests that o3-mini may scale its reasoning more aggressively with problem size compared to the other two models.