\n
## Scatter Plot with Regression Lines: Reasoning Tokens vs. Problem Size
### Overview
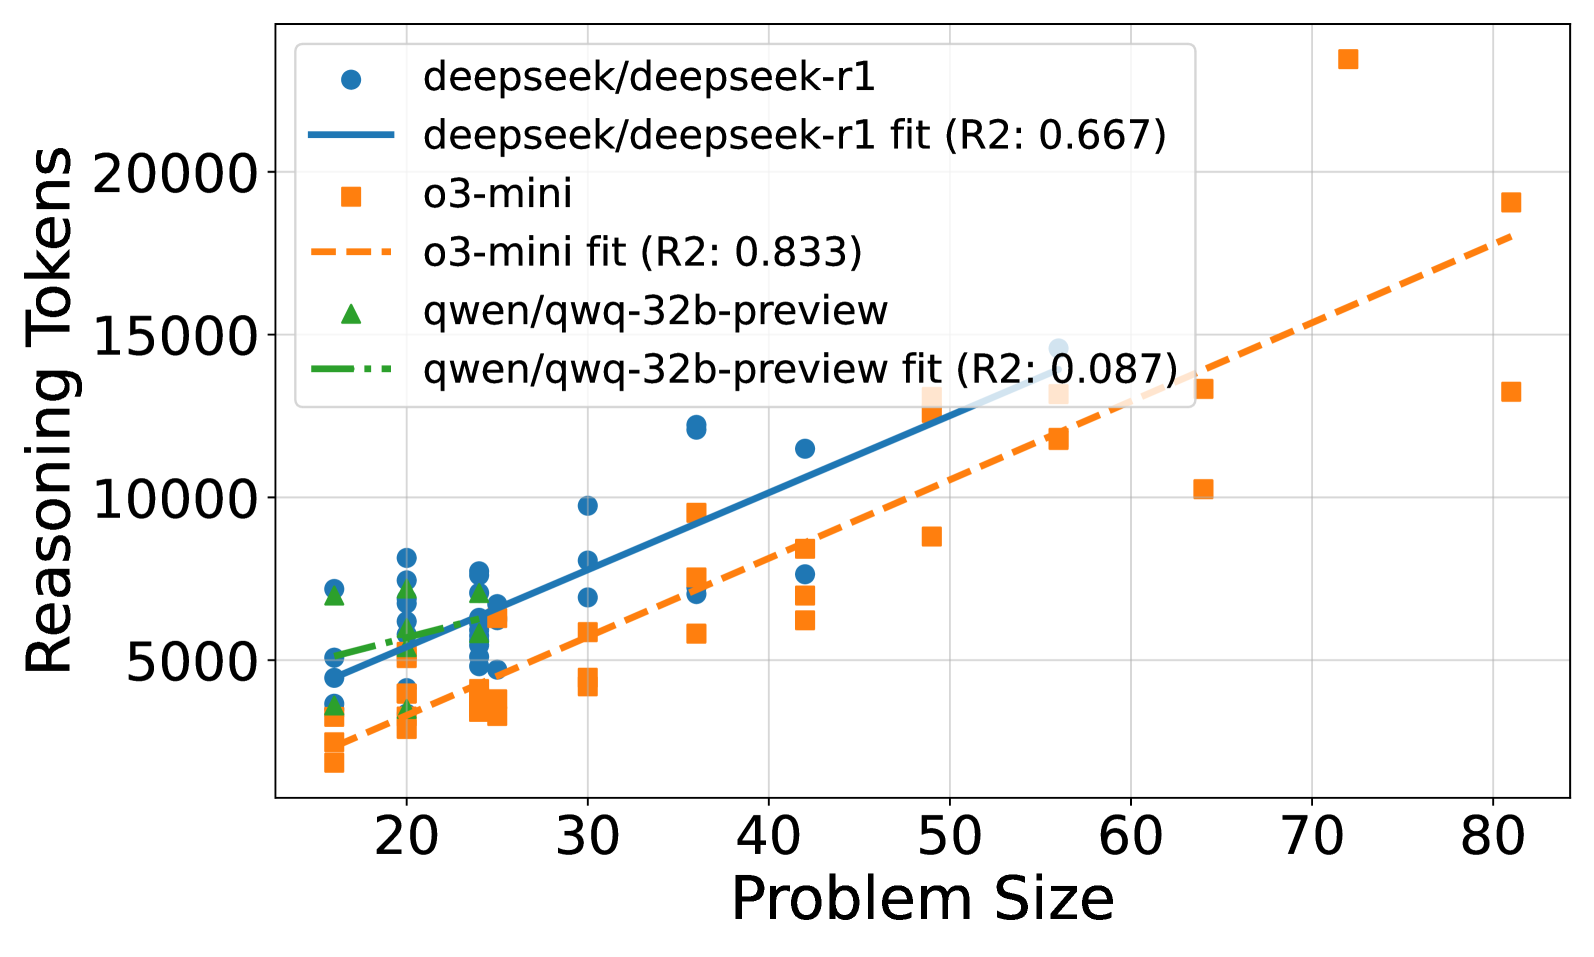
The image is a scatter plot comparing the "Reasoning Tokens" (Y-axis) against "Problem Size" (X-axis) for three different AI models. Each model's data points are plotted with a unique marker, and a linear regression fit line is provided for each series. The plot includes a legend in the top-left corner identifying the models and their corresponding fit lines with R² values.
### Components/Axes
* **X-Axis:** Labeled "Problem Size". The scale runs from approximately 15 to 85, with major tick marks at 20, 30, 40, 50, 60, 70, and 80.
* **Y-Axis:** Labeled "Reasoning Tokens". The scale runs from approximately 0 to 24,000, with major tick marks at 5000, 10000, 15000, and 20000.
* **Legend (Top-Left):**
* `deepseek/deepseek-r1`: Blue circle marker.
* `deepseek/deepseek-r1 fit (R2: 0.667)`: Solid blue line.
* `o3-mini`: Orange square marker.
* `o3-mini fit (R2: 0.833)`: Dashed orange line.
* `qwen/qwq-32b-preview`: Green triangle marker.
* `qwen/qwq-32b-preview fit (R2: 0.087)`: Dash-dot green line.
### Detailed Analysis
**Data Series and Trends:**
1. **deepseek/deepseek-r1 (Blue Circles & Solid Blue Line):**
* **Trend:** The data shows a clear positive correlation. The solid blue regression line slopes upward from left to right.
* **Data Points (Approximate):** Points are clustered between Problem Sizes of ~15 to ~55. Reasoning Tokens range from ~4,500 at the low end to ~15,000 at the high end. Notable points include a cluster around (20, 5000-8000) and a high point near (55, 15000).
* **Fit:** The linear fit has an R² value of 0.667, indicating a moderately strong fit to the data.
2. **o3-mini (Orange Squares & Dashed Orange Line):**
* **Trend:** This series also shows a strong positive correlation, with a steeper slope than the deepseek-r1 line. The dashed orange regression line rises sharply.
* **Data Points (Approximate):** Points span a wider range of Problem Sizes, from ~15 to ~80. Reasoning Tokens start lower (~2,000 at Problem Size 15) but reach the highest values on the chart, with a significant outlier near (70, 23000). Other high points are near (80, 19000) and (80, 13000).
* **Fit:** The linear fit has the highest R² value of 0.833, suggesting a strong linear relationship.
3. **qwen/qwq-32b-preview (Green Triangles & Dash-Dot Green Line):**
* **Trend:** The visible data points are few and clustered in a narrow range. The green dash-dot fit line is nearly flat, showing a very weak positive slope.
* **Data Points (Approximate):** Only about 4-5 data points are visible, all located between Problem Sizes of ~15 and ~25. Their Reasoning Token values are between ~3,000 and ~7,000.
* **Fit:** The linear fit has a very low R² of 0.087, indicating the line does not explain the variance in the data well (likely due to the sparse and clustered data).
### Key Observations
* **Scaling Behavior:** Both `o3-mini` and `deepseek-r1` demonstrate that Reasoning Tokens increase with Problem Size. `o3-mini` exhibits a steeper scaling curve.
* **Data Spread:** The `o3-mini` data has the largest spread, especially at higher Problem Sizes (e.g., at Problem Size ~80, tokens range from ~13,000 to ~19,000).
* **Outlier:** A prominent outlier exists for `o3-mini` at approximately (Problem Size: 70, Reasoning Tokens: 23000), which is the highest token count on the chart.
* **Limited Data for Qwen:** The `qwen/qwq-32b-preview` model has insufficient data points across the Problem Size range to establish a reliable trend, as reflected by its poor R² value.
* **Legend Accuracy:** The colors and markers in the legend (blue circle, orange square, green triangle) correspond exactly to the data points and their respective fit lines on the plot.
### Interpretation
This chart analyzes how the computational "reasoning" effort (measured in tokens) of different AI models scales with the complexity or size of a problem. The data suggests that for the tasks measured, the `o3-mini` model's token usage is highly predictable (high R²) and scales more aggressively with problem size than `deepseek-r1`. The `deepseek-r1` model also scales positively but with more variability. The `qwen/qwq-32b-preview` model's performance is inconclusive from this data; the near-zero R² suggests either that problem size is not a primary driver of its token usage for this task range, or that the model's behavior is highly inconsistent. The outlier for `o3-mini` at Problem Size 70 could indicate a specific problem type that triggered an exceptionally long reasoning chain, or a potential anomaly in the data collection. Overall, the visualization is a tool for comparing model efficiency and predictability in resource allocation (tokens) as task difficulty increases.