## Heatmap: Music Token Position vs. Lyrics Token Position Alignment
### Overview
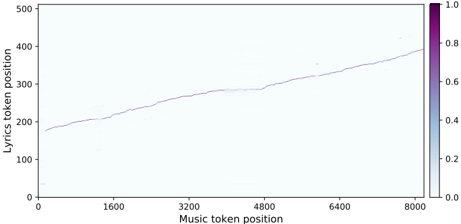
This image is a 2D heatmap visualization, likely representing an attention map or alignment matrix from a machine learning model (such as a Transformer-based architecture). It plots the relationship between "Music token position" (x-axis) and "Lyrics token position" (y-axis). The visualization demonstrates how the model aligns specific segments of music with corresponding lyrical content over time.
### Components/Axes
* **X-Axis (Horizontal):** Labeled "Music token position". The scale ranges from 0 to 8000, with major tick marks at 0, 1600, 3200, 4800, 6400, and 8000.
* **Y-Axis (Vertical):** Labeled "Lyrics token position". The scale ranges from 0 to 500, with major tick marks at 0, 100, 200, 300, 400, and 500.
* **Legend (Right side):** A vertical color bar representing the intensity of the alignment/attention score.
* **0.0 (White):** Indicates no or minimal alignment/attention.
* **1.0 (Dark Purple):** Indicates high alignment/attention.
* **Main Plot Area:** A central region displaying a diagonal line of varying intensity (light blue to dark purple) against a near-white background.
### Detailed Analysis
* **Trend Verification:** The primary data series is a continuous, slightly jagged diagonal line that slopes upward from the bottom-left quadrant toward the top-right quadrant. This indicates a monotonic, positive correlation: as the music token position increases, the lyrics token position also increases.
* **Data Points (Approximate):**
* **Start Point:** The alignment begins at approximately (x=200, y=180).
* **End Point:** The alignment terminates at approximately (x=8200, y=400).
* **Slope:** The line covers a range of ~8000 music tokens for ~220 lyrics tokens (400 - 180). This indicates a significantly higher density of music tokens compared to lyrics tokens.
* **Visual Characteristics:**
* The line is not perfectly smooth; it exhibits small, step-like discontinuities.
* There are faint, scattered artifacts (low-intensity noise) visible off the main diagonal, particularly in the lower-left and mid-right regions, suggesting minor, non-primary attention weights.
### Key Observations
* **Asymmetry:** The x-axis (8000) is significantly longer than the y-axis (500), indicating that the music sequence is roughly 16 times longer in terms of token count than the lyrics sequence.
* **Discontinuities:** The "steps" in the diagonal line suggest that the alignment is not strictly linear. These breaks likely correspond to structural changes in the audio (e.g., instrumental breaks, chorus/verse transitions, or pauses) where the lyrics do not progress at a constant rate relative to the music.
* **Intensity:** The line is generally light-to-medium purple, suggesting that while there is a clear alignment, the attention is distributed rather than highly concentrated on single points.
### Interpretation
This visualization demonstrates the temporal alignment between a music sequence and its corresponding lyrics.
* **Model Behavior:** The diagonal structure confirms that the model has successfully learned the temporal progression of the song. It understands that later music tokens correspond to later lyrics tokens.
* **Structural Insights:** The discontinuities in the diagonal are the most significant feature. In a musical context, these likely represent sections where the lyrics are sparse or absent (instrumental sections), causing the "Lyrics token position" to plateau while the "Music token position" continues to advance.
* **Peircean Investigative Note:** The presence of faint, off-diagonal noise suggests that the model is not perfectly confident in its alignment at all times, or that there is a degree of "soft attention" where the model considers multiple potential alignments simultaneously. The overall trend is highly robust, indicating a successful training outcome for sequence alignment.