## Heatmap Visualization: Attention and Saliency Analysis
### Overview
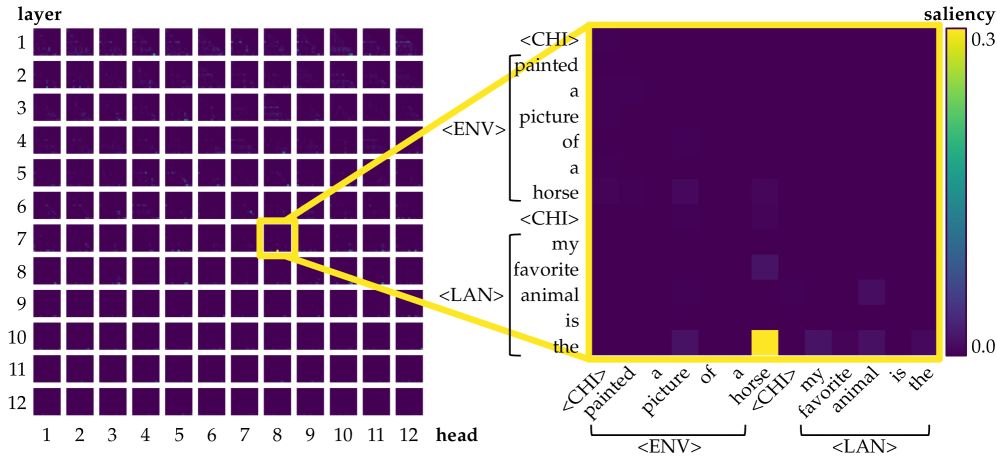
The image presents a dual-part visualization:
1. **Left Grid**: A 12x12 matrix labeled "layer" (vertical axis) and "head" (horizontal axis), with a highlighted cell at layer 7, head 8.
2. **Right Heatmap**: A word-based saliency map with a color scale from 0.0 (dark purple) to 0.3 (yellow), highlighting the word "horse" in yellow.
The visualization connects the left grid to the right heatmap via yellow arrows, suggesting a relationship between attention patterns and word saliency.
---
### Components/Axes
#### Left Grid (Attention Matrix)
- **Vertical Axis (Layer)**: Labeled "layer" with values 1–12.
- **Horizontal Axis (Head)**: Labeled "head" with values 1–12.
- **Highlighted Cell**: Layer 7, Head 8 (marked with a yellow square).
- **Color Scale**: Not explicitly labeled, but the highlighted cell is yellow, implying higher attention.
#### Right Heatmap (Saliency Map)
- **Vertical Axis (Words)**: Contains phrases like `<CHI> painted a picture of a horse <CHI> my favorite animal is the`.
- **Horizontal Axis (Words)**: Contains phrases like `<ENV> <LAN>`.
- **Color Scale**: Labeled "saliency" with values 0.0 (dark purple) to 0.3 (yellow).
- **Highlighted Cell**: The word "horse" (yellow).
#### Legend
- **Color Bar**: Positioned to the right of the heatmap, transitioning from dark purple (0.0) to yellow (0.3).
---
### Detailed Analysis
#### Left Grid (Attention Matrix)
- **Structure**: 12x12 grid with uniform dark purple cells except for the highlighted cell at (7, 8).
- **Trend**: No discernible pattern in the grid; the highlighted cell is an outlier.
- **Uncertainty**: No numerical values provided for other cells, only the highlighted cell’s saliency is implied.
#### Right Heatmap (Saliency Map)
- **Structure**: 12x12 grid with varying shades of purple and yellow.
- **Key Data Points**:
- The word "horse" is the brightest (yellow), indicating the highest saliency.
- Other words (e.g., "painted," "picture," "favorite") show lower saliency (darker purple).
- **Trend**: The saliency decreases from "horse" outward, with no other words reaching the yellow threshold.
---
### Key Observations
1. **Outlier in Left Grid**: The highlighted cell at layer 7, head 8 is the only cell with a distinct color, suggesting it is the most active attention head in that layer.
2. **Saliency Focus**: The word "horse" dominates the right heatmap, indicating it is the most salient term in the text.
3. **Connection**: The yellow arrows linking the left grid to the right heatmap imply that the attention in layer 7, head 8 is directly tied to the saliency of "horse."
---
### Interpretation
- **Attention-Saliency Relationship**: The visualization suggests that the model’s attention in layer 7, head 8 is concentrated on the word "horse," which is the most salient term in the text. This could indicate that the model prioritizes this word for tasks like classification or generation.
- **Model Behavior**: The lack of other highlighted cells in the left grid implies that this specific head-layer combination is uniquely responsible for processing the salient word.
- **Implications**: This could reflect how the model encodes specific concepts (e.g., "horse") in its internal representations, with certain attention heads specializing in particular linguistic features.
---
**Note**: The image does not contain numerical values for non-highlighted cells, limiting quantitative analysis. The interpretation relies on visual cues and the explicit connection between the grid and heatmap.