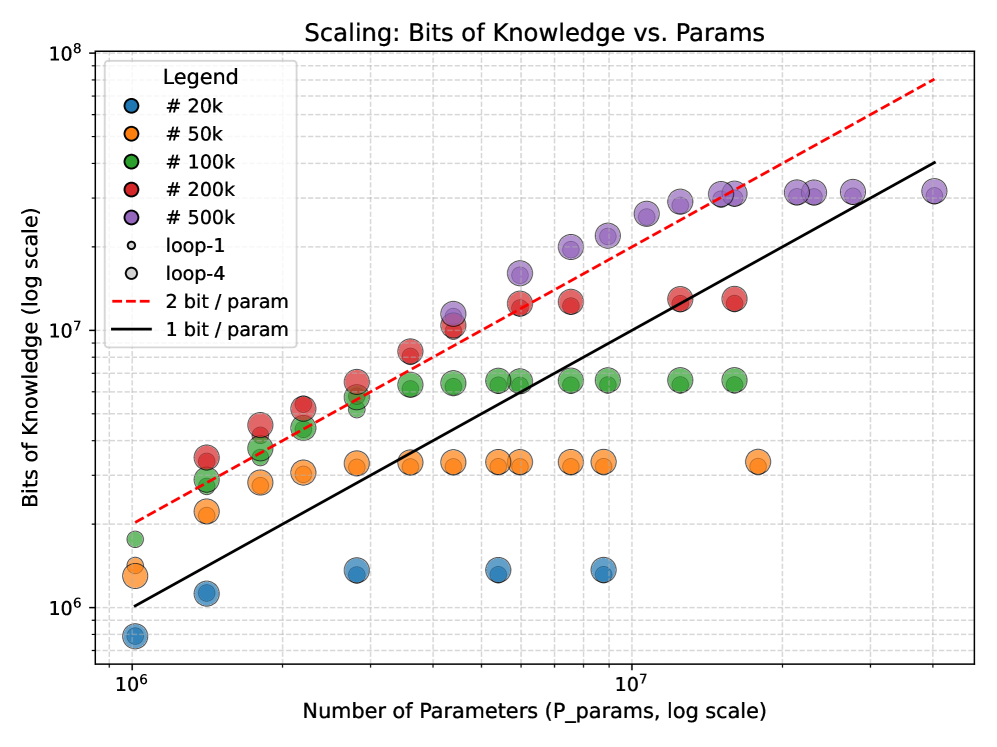
## Scatter Plot: Scaling: Bits of Knowledge vs. Params
### Overview
The image is a scatter plot visualizing the relationship between the number of parameters (P_params) and the bits of knowledge (log scale) in a machine learning or AI context. The plot uses logarithmic scales for both axes, with data points color-coded by parameter count and trend lines indicating theoretical efficiency thresholds (1 bit/param and 2 bits/param).
---
### Components/Axes
- **Title**: "Scaling: Bits of Knowledge vs. Params" (centered at the top).
- **X-axis**: "Number of Parameters (P_params, log scale)" with values ranging from 10⁶ to 10⁷.
- **Y-axis**: "Bits of Knowledge (log scale)" with values ranging from 10⁶ to 10⁸.
- **Legend**: Located in the top-left corner, with color-coded labels:
- Blue: #20k
- Orange: #50k
- Green: #100k
- Red: #200k
- Purple: #500k
- Open circles: loop-1
- Gray circles: loop-4
- Dashed red line: 2 bit / param
- Solid black line: 1 bit / param
---
### Detailed Analysis
#### Data Points
- **Parameter Counts**:
- **#20k (blue)**: Data points cluster near the bottom-left (x ≈ 10⁶, y ≈ 10⁶–10⁷).
- **#50k (orange)**: Slightly higher on the y-axis (x ≈ 10⁶–10⁷, y ≈ 10⁶–10⁷).
- **#100k (green)**: Mid-range (x ≈ 10⁶–10⁷, y ≈ 10⁷–10⁸).
- **#200k (red)**: Higher y-values (x ≈ 10⁶–10⁷, y ≈ 10⁷–10⁸).
- **#500k (purple)**: Top-right (x ≈ 10⁷, y ≈ 10⁷–10⁸).
- **Loop-1 (open circles)**: Overlaps with #200k and #500k data points, suggesting similar parameter ranges.
- **Loop-4 (gray circles)**: Overlaps with #100k and #200k data points.
#### Trend Lines
- **1 bit / param (solid black line)**: A linear trend line passing through the lower half of the plot, indicating a baseline efficiency threshold.
- **2 bit / param (dashed red line)**: A steeper trend line above the 1 bit/param line, representing a higher efficiency benchmark.
---
### Key Observations
1. **Parameter vs. Knowledge Correlation**:
- Higher parameter counts (e.g., #500k) generally correspond to higher bits of knowledge, but the relationship is not strictly linear.
- Data points for #20k and #50k are clustered near the lower y-axis, while #500k points dominate the upper y-axis.
2. **Trend Line Behavior**:
- The **1 bit/param line** aligns with the lower half of the data, suggesting that many models operate near this efficiency threshold.
- The **2 bit/param line** is above most data points, indicating that achieving this efficiency is rare or requires specific optimizations.
3. **Data Point Overlaps**:
- Open circles (loop-1) and gray circles (loop-4) overlap with red (#200k) and purple (#500k) points, suggesting shared parameter ranges or experimental conditions.
4. **Logarithmic Scale Impact**:
- The log scales compress the data, making trends across orders of magnitude more visible (e.g., 10⁶ to 10⁷ parameters).
---
### Interpretation
- **Efficiency Trends**: The plot highlights a trade-off between parameter count and knowledge efficiency. While more parameters generally increase knowledge, the **2 bit/param threshold** remains a high benchmark, suggesting that many models are sub-optimal in terms of parameter efficiency.
- **Model Variability**: The spread of data points (e.g., #500k) indicates variability in how parameters translate to knowledge, possibly due to architectural differences or training data quality.
- **Theoretical vs. Empirical**: The trend lines may represent theoretical expectations (e.g., 1 bit/param as a baseline), while the data points reflect empirical results. The gap between the lines and data points could indicate room for improvement in model design.
---
### Notable Anomalies
- **#500k Data Points**: Some points are slightly below the 2 bit/param line, suggesting that even large models may not always meet the highest efficiency thresholds.
- **Loop-1/Loop-4 Overlaps**: The open and gray circles may represent different experimental setups (e.g., training iterations or hyperparameters) that share parameter ranges with larger models.
---
### Conclusion
The plot demonstrates that increasing parameter counts correlate with higher bits of knowledge, but efficiency (bits per parameter) varies significantly. The 2 bit/param line serves as a critical benchmark, while the 1 bit/param line reflects a more common baseline. The data underscores the importance of optimizing parameter efficiency in large-scale models.