\n
## Diagram: State Transition/Flow Diagram
### Overview
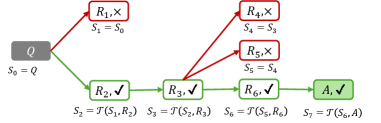
The image depicts a state transition or flow diagram, likely representing a process or algorithm. It starts with an initial state 'Q' and progresses through a series of states (R1 to R6) and a final state 'A'. Each transition is associated with a transformation 'T' and a state update (S). Some transitions are marked with a red 'X' indicating failure, while others are marked with a green checkmark indicating success.
### Components/Axes
The diagram consists of:
* **States:** Represented by labeled rectangles (Q, R1, R2, R3, R4, R5, R6, A).
* **Transitions:** Represented by arrows connecting the states.
* **Labels:** Text associated with each state and transition, including state updates (S1 to S7) and transformation function (T).
* **Indicators:** Red 'X' and green checkmarks indicating success or failure of a transition.
* **Initial State:** 'Q' is a gray rectangle, indicating the starting point.
### Detailed Analysis or Content Details
The diagram can be broken down as follows:
1. **Initial State:** Q, with S0 = Q.
2. **Transition 1:** From Q to R1. This transition is marked with a red 'X', indicating failure. S1 = S0.
3. **Transition 2:** From Q to R2. This transition is marked with a green checkmark, indicating success. S2 = T(S1, R2).
4. **Transition 3:** From R2 to R3. This transition is marked with a green checkmark, indicating success. S3 = T(S2, R3).
5. **Transition 4:** From R3 to R6. This transition is marked with a green checkmark, indicating success. S6 = T(S5, R6).
6. **Transition 5:** From R6 to A. This transition is marked with a green checkmark, indicating success. S7 = T(S6, A).
7. **Branching from R3:** There are two branches originating from R3.
* **Branch 1:** From R3 to R4. This transition is marked with a red 'X', indicating failure. S4 = S3.
* **Branch 2:** From R3 to R5. This transition is marked with a red 'X', indicating failure. S5 = S4.
### Key Observations
* The diagram shows a branching process with potential failure points.
* The success path leads from Q -> R2 -> R3 -> R6 -> A.
* The failure paths lead to states R1, R4, and R5, which do not contribute to reaching the final state A.
* The state updates (S) are dependent on the previous state and the target state, using the transformation function T.
* The diagram suggests a process where multiple attempts or paths are possible, but only one leads to the desired outcome.
### Interpretation
This diagram likely represents a search or optimization algorithm, or a decision-making process with multiple possible outcomes. The 'T' function could represent a test or evaluation, and the checkmarks/Xs indicate whether the test passed or failed. The states R1, R4, and R5 represent dead ends or unsuccessful attempts, while the path through R2, R3, R6 leads to the successful outcome A. The state updates (S) suggest that the algorithm maintains and modifies a state variable as it progresses through the process. The diagram illustrates a scenario where the algorithm may need to explore multiple paths before finding the correct one. The repeated use of the transformation function 'T' suggests an iterative process. The diagram does not provide specific details about the nature of the transformation 'T' or the meaning of the states, but it provides a clear visual representation of the process flow and potential outcomes.