## Histogram: Distribution of Thinking Tokens
### Overview
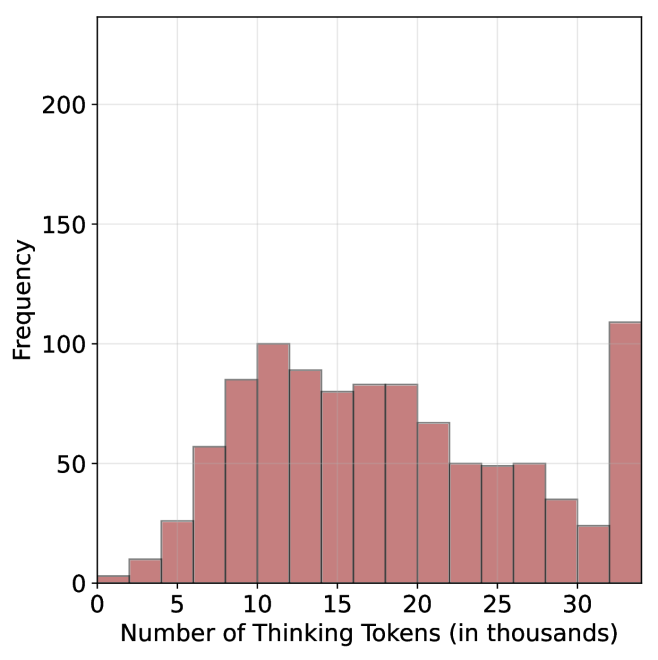
This image is a histogram visualizing the frequency distribution of "Thinking Tokens" used by a system (likely an AI model). The x-axis represents the quantity of tokens in thousands, and the y-axis represents the frequency of occurrences. The distribution is characterized by a primary bell-shaped cluster followed by a significant, anomalous spike at the upper bound of the data range.
### Components/Axes
* **Y-Axis (Vertical):** Labeled "Frequency". The scale ranges from 0 to 200, with major grid lines at 50-unit intervals (0, 50, 100, 150, 200).
* **X-Axis (Horizontal):** Labeled "Number of Thinking Tokens (in thousands)". The scale ranges from 0 to 30+, with major tick marks at intervals of 5 (0, 5, 10, 15, 20, 25, 30).
* **Data Series:** Represented by 16 vertical bars of a muted red-brown color. Each bar represents a specific range (bin) of token counts.
### Detailed Analysis
The histogram displays a non-normal, multimodal distribution. The trend rises steadily from 0, peaks, fluctuates, and then exhibits a sharp, unexpected spike at the final bin.
**Estimated Data Points (Frequency per Bin):**
| Token Range (k) | Estimated Frequency |
| :--- | :--- |
| 0 – 2 | ~5 |
| 2 – 4 | ~10 |
| 4 – 6 | ~30 |
| 6 – 8 | ~60 |
| 8 – 10 | ~85 |
| 10 – 12 | ~100 (Primary peak) |
| 12 – 14 | ~90 |
| 14 – 16 | ~80 |
| 16 – 18 | ~85 |
| 18 – 20 | ~85 |
| 20 – 22 | ~70 |
| 22 – 24 | ~50 |
| 24 – 26 | ~50 |
| 26 – 28 | ~50 |
| 28 – 30 | ~35 |
| 30 – 32 | ~25 |
| 32+ (Final Bin) | ~110 (Secondary, anomalous peak) |
### Key Observations
1. **Primary Distribution:** The bulk of the data falls between 5,000 and 20,000 tokens, with a clear mode (most frequent value) occurring in the 10,000–12,000 token range.
2. **The "Overflow" Spike:** The most notable feature is the final bar (32k+ tokens). Despite the general downward trend of the distribution after 12,000 tokens, this final bin is the highest in the entire chart, exceeding the primary peak.
3. **Distribution Shape:** The data is right-skewed, excluding the final outlier bin.
### Interpretation
The data suggests a system that typically performs "thinking" tasks within a range of 5,000 to 20,000 tokens.
The significant spike at the final bin (32k+) is highly indicative of a **hard constraint or truncation limit**. In technical contexts, this pattern often appears when a system has a maximum token limit (e.g., a context window or a "max_tokens" setting). The spike represents all instances where the model *wanted* to continue thinking but was forced to stop because it hit the maximum allowed token count.
Therefore, the chart demonstrates that while the model's natural "thinking" requirement is usually well under 30,000 tokens, a substantial portion of tasks are being cut off prematurely by a system-imposed limit.