## Chart Type: Bar Chart
### Overview
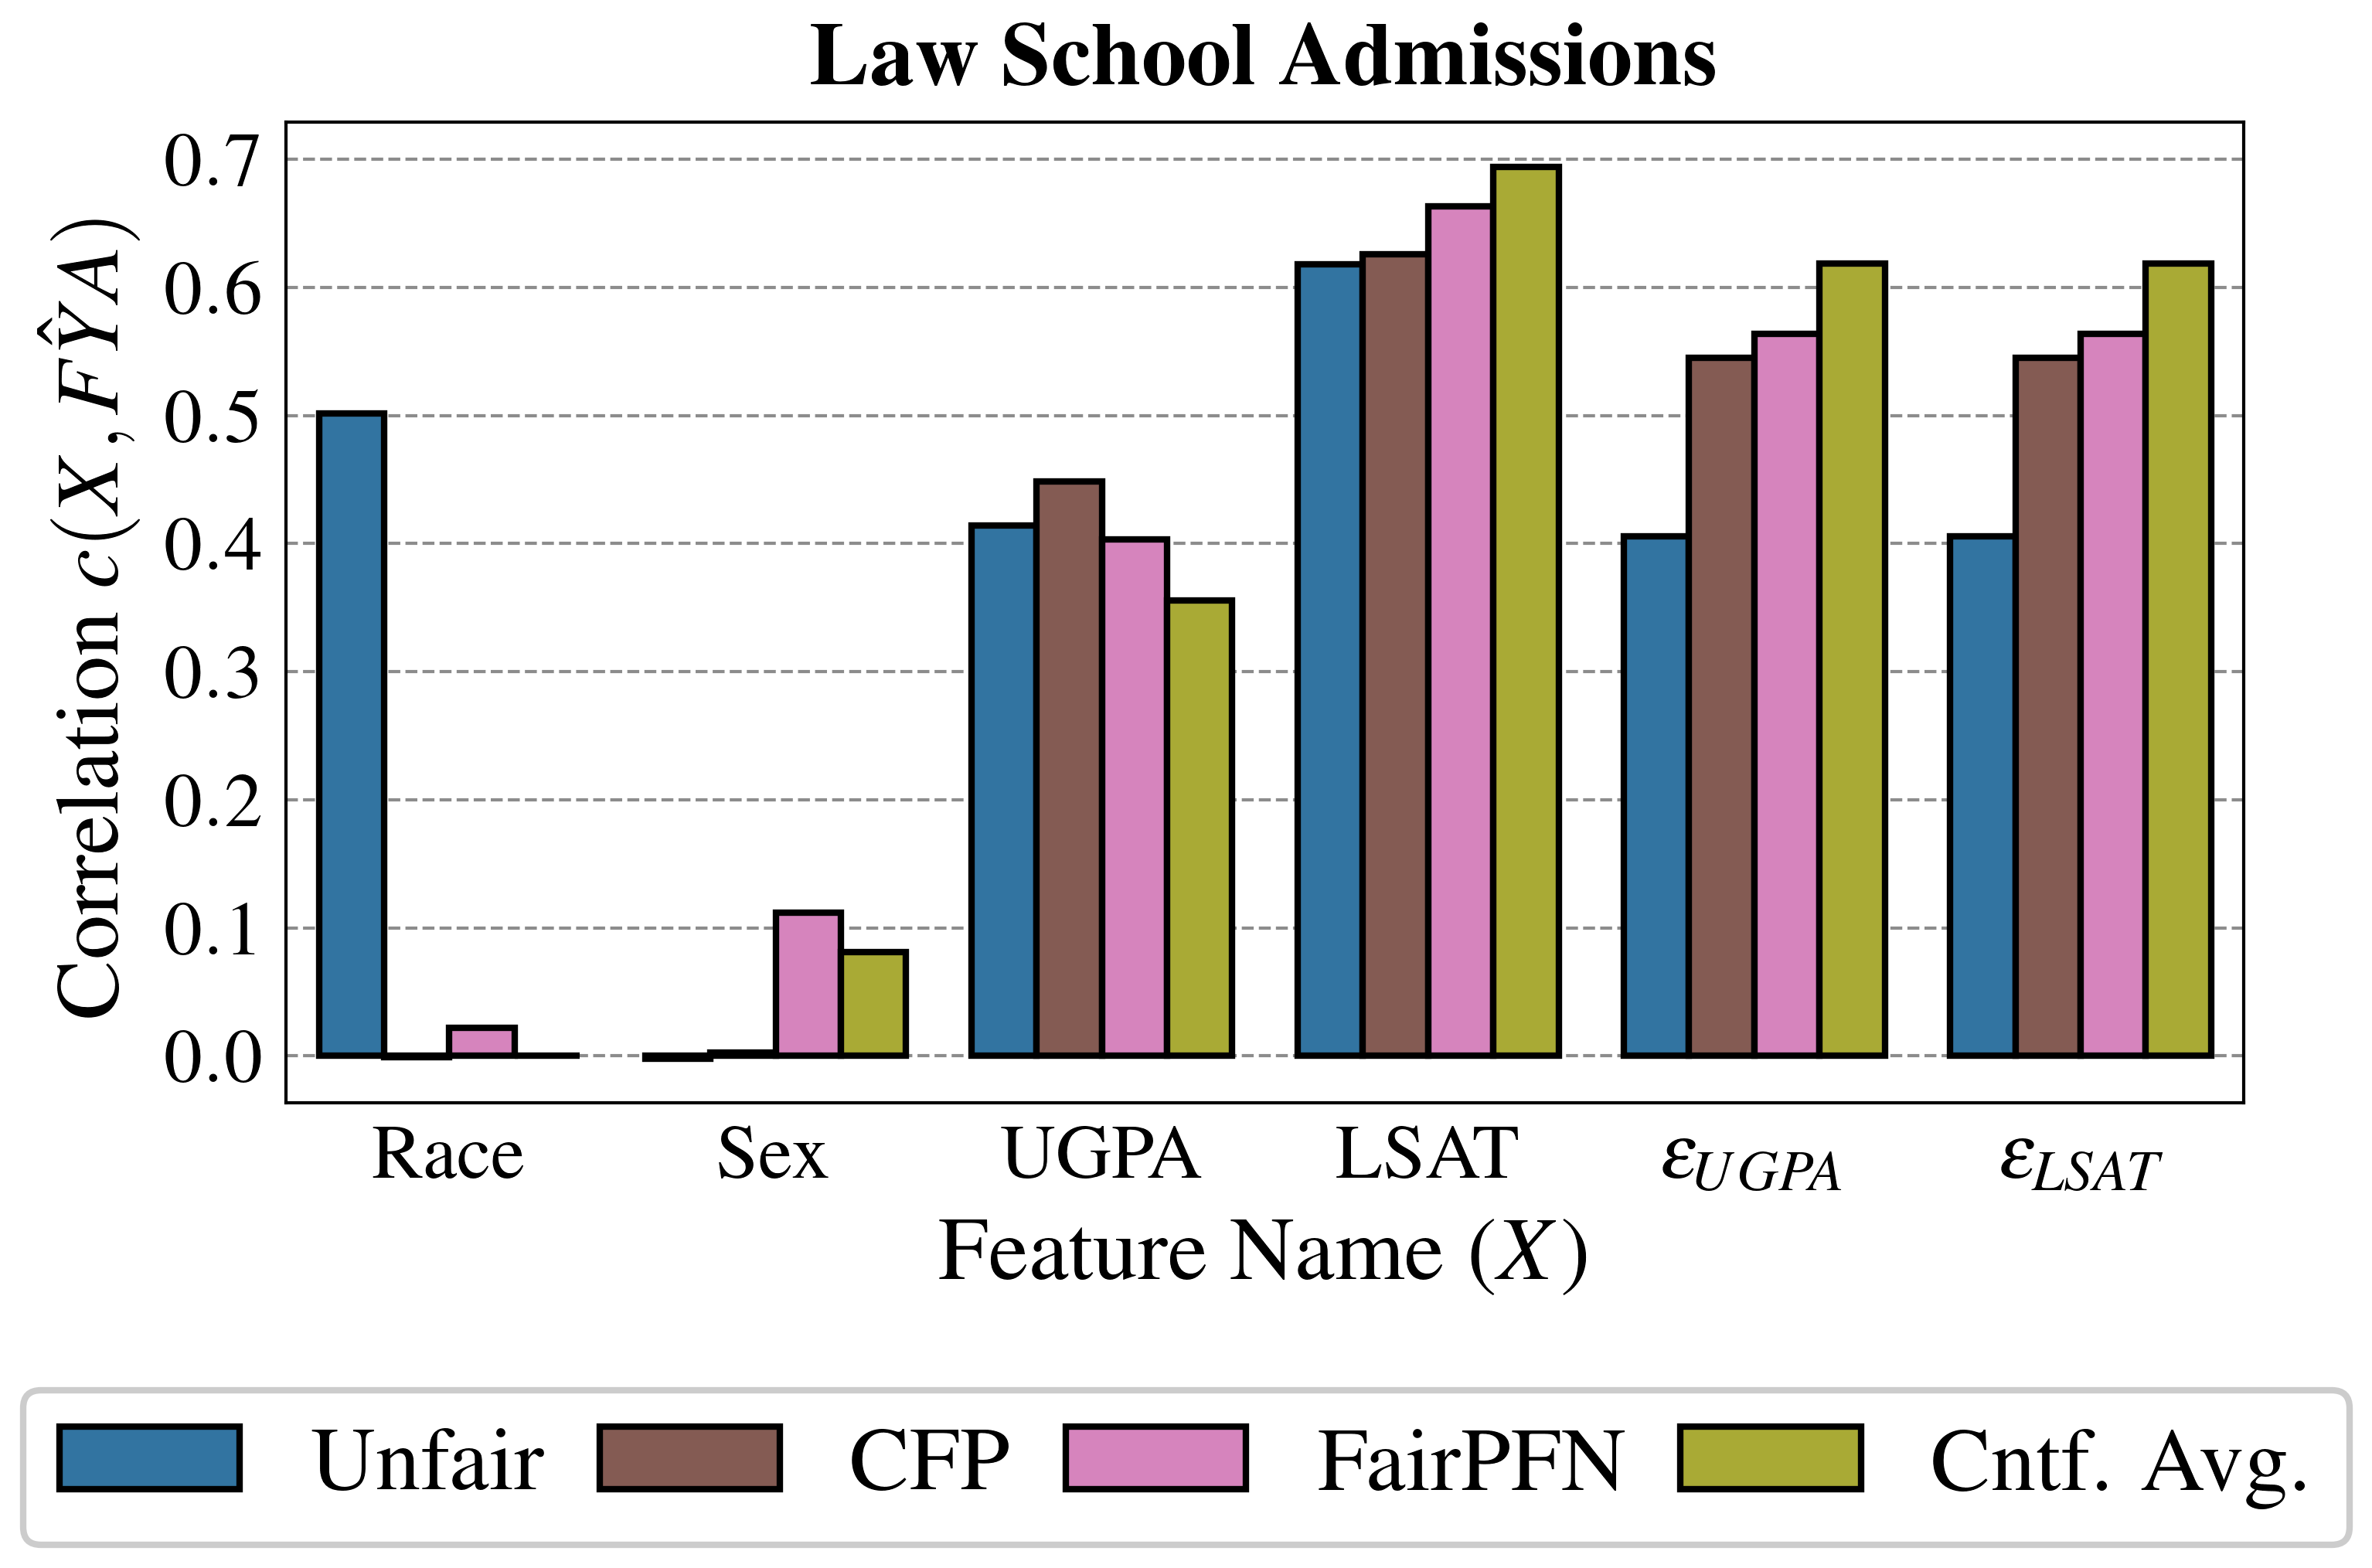
The image is a bar chart titled "Law School Admissions". It compares the correlation between different features (Race, Sex, UGPA, LSAT, εUGPA, εLSAT) and law school admissions (FŶA) using four different methods: Unfair, CFP, FairPFN, and Cntf. Avg. The chart uses vertical bars to represent the correlation values for each feature and method.
### Components/Axes
* **Title:** Law School Admissions
* **X-axis:** Feature Name (X) with categories: Race, Sex, UGPA, LSAT, εUGPA, εLSAT
* **Y-axis:** Correlation c(X, FŶA) with a scale from 0.0 to 0.7, incrementing by 0.1.
* **Legend:** Located at the bottom of the chart.
* Blue: Unfair
* Brown: CFP
* Pink: FairPFN
* Olive Green: Cntf. Avg.
### Detailed Analysis
Here's a breakdown of the correlation values for each feature and method:
* **Race:**
* Unfair (Blue): ~0.5
* CFP (Brown): ~0.0
* FairPFN (Pink): ~0.02
* Cntf. Avg. (Olive Green): ~0.0
* **Sex:**
* Unfair (Blue): ~0.0
* CFP (Brown): ~0.0
* FairPFN (Pink): ~0.11
* Cntf. Avg. (Olive Green): ~0.08
* **UGPA:**
* Unfair (Blue): ~0.42
* CFP (Brown): ~0.45
* FairPFN (Pink): ~0.41
* Cntf. Avg. (Olive Green): ~0.36
* **LSAT:**
* Unfair (Blue): ~0.62
* CFP (Brown): ~0.63
* FairPFN (Pink): ~0.67
* Cntf. Avg. (Olive Green): ~0.69
* **εUGPA:**
* Unfair (Blue): ~0.41
* CFP (Brown): ~0.55
* FairPFN (Pink): ~0.57
* Cntf. Avg. (Olive Green): ~0.62
* **εLSAT:**
* Unfair (Blue): ~0.41
* CFP (Brown): ~0.55
* FairPFN (Pink): ~0.57
* Cntf. Avg. (Olive Green): ~0.62
### Key Observations
* Race has a high correlation with the "Unfair" method, but very low correlation with the other methods.
* Sex has a very low correlation across all methods.
* UGPA and LSAT have relatively high correlations across all methods.
* The "Cntf. Avg." method generally shows the highest correlation for UGPA, LSAT, εUGPA, and εLSAT.
* The "Unfair" method shows the highest correlation for Race.
### Interpretation
The chart suggests that race is a significant factor in law school admissions when using the "Unfair" method, but not when using the other methods. Sex appears to have minimal correlation with admissions regardless of the method used. UGPA and LSAT scores are consistently correlated with admissions across all methods, with the "Cntf. Avg." method showing the strongest correlation. The variables εUGPA and εLSAT also show a strong correlation with admissions, especially when using the "Cntf. Avg." method. This indicates that these features are important predictors of law school admissions outcomes.