## Bar Chart: Law School Admissions - Correlation Analysis
### Overview
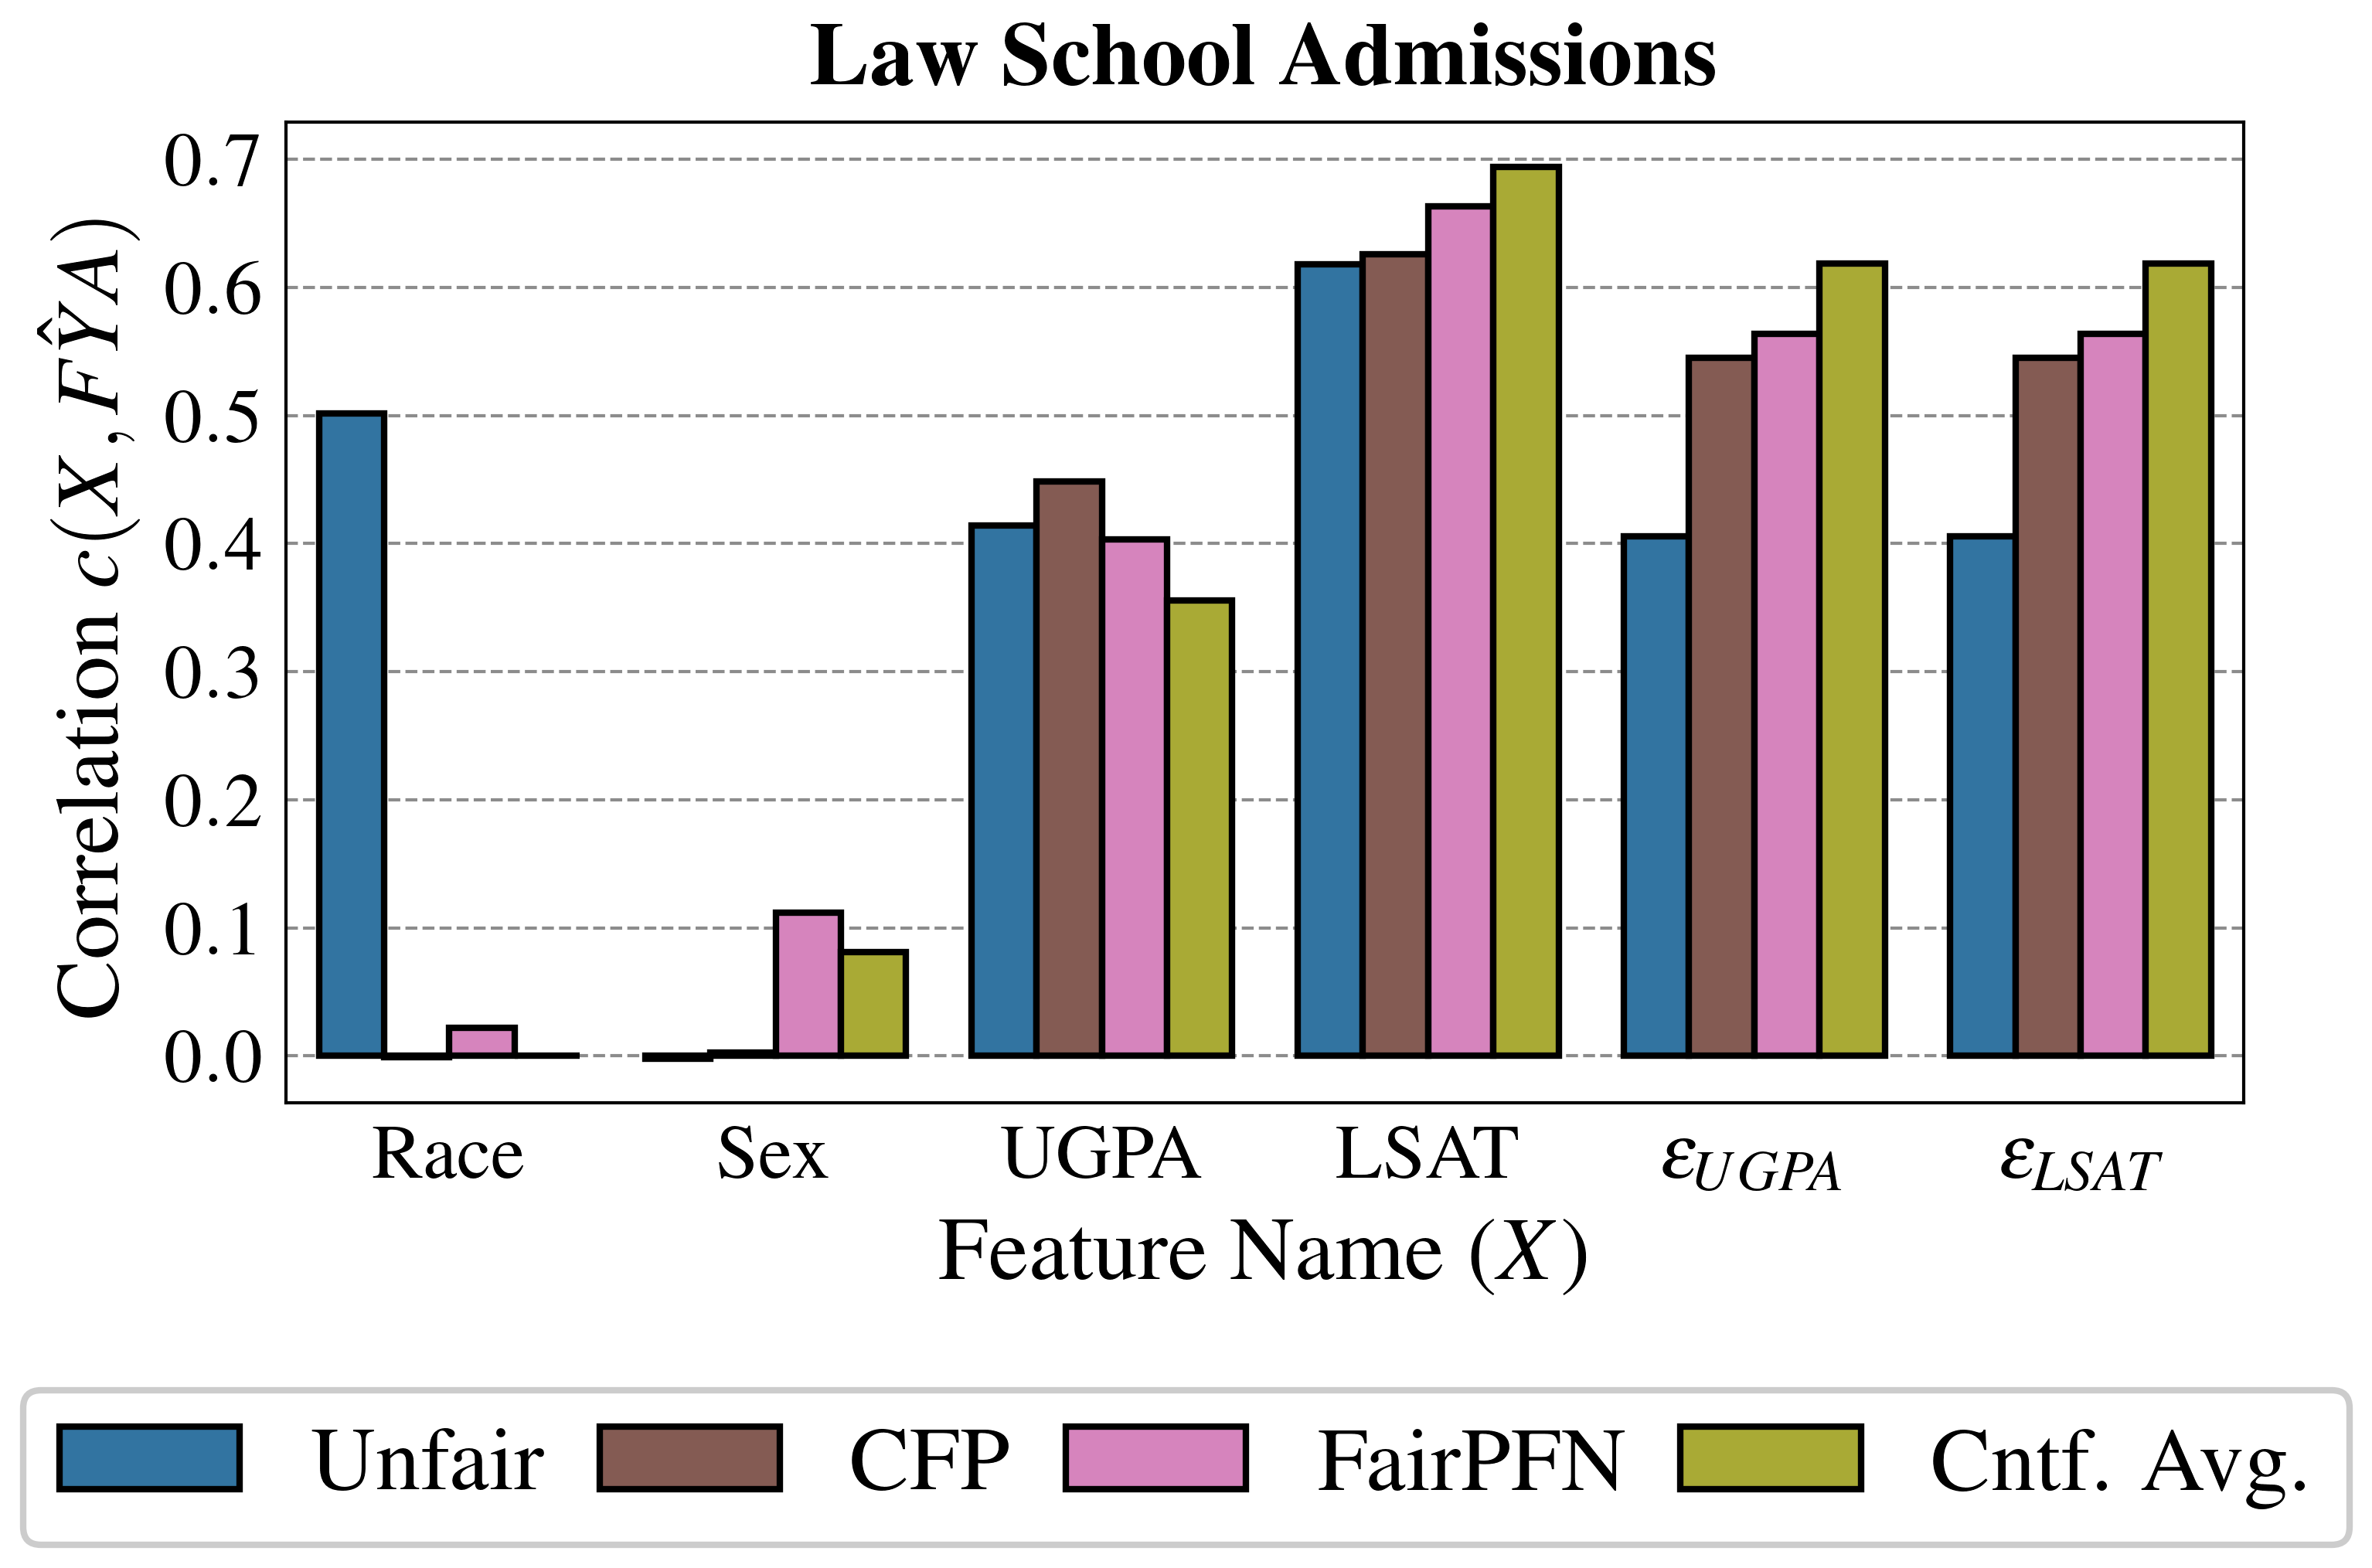
This bar chart visualizes the correlation between various features (Race, Sex, UGPA, LSAT, εUGPA, εLSAT) and the predicted admission outcome (ŶA) under different fairness constraints. The chart compares the correlation coefficients for "Unfair", "CFP", "FairPFN", and "Cntf. Avg." models. The y-axis represents the correlation coefficient, while the x-axis lists the features.
### Components/Axes
* **Title:** Law School Admissions
* **X-axis:** Feature Name (X) - Categories: Race, Sex, UGPA, LSAT, εUGPA, εLSAT
* **Y-axis:** Correlation c(X, ŶA) - Scale: 0.0 to 0.7 (with increments of 0.1)
* **Legend:**
* Unfair (Blue)
* CFP (Gray)
* FairPFN (Magenta/Pink)
* Cntf. Avg. (Light Green)
### Detailed Analysis
The chart consists of six groups of four bars, one group for each feature. Each bar represents the correlation coefficient for a specific fairness constraint.
**Race:**
* Unfair: Approximately 0.52
* CFP: Approximately 0.02
* FairPFN: Approximately 0.01
* Cntf. Avg.: Approximately 0.01
**Sex:**
* Unfair: Approximately 0.11
* CFP: Approximately 0.08
* FairPFN: Approximately 0.05
* Cntf. Avg.: Approximately 0.09
**UGPA:**
* Unfair: Approximately 0.45
* CFP: Approximately 0.42
* FairPFN: Approximately 0.44
* Cntf. Avg.: Approximately 0.43
**LSAT:**
* Unfair: Approximately 0.64
* CFP: Approximately 0.62
* FairPFN: Approximately 0.66
* Cntf. Avg.: Approximately 0.65
**εUGPA:**
* Unfair: Approximately 0.67
* CFP: Approximately 0.64
* FairPFN: Approximately 0.68
* Cntf. Avg.: Approximately 0.66
**εLSAT:**
* Unfair: Approximately 0.61
* CFP: Approximately 0.59
* FairPFN: Approximately 0.63
* Cntf. Avg.: Approximately 0.62
### Key Observations
* The "Unfair" model consistently exhibits the highest correlation coefficients across all features, indicating a strong predictive power without fairness considerations.
* The "CFP" model generally shows the lowest correlation coefficients, particularly for "Race" and "Sex", suggesting a significant reduction in predictive power when attempting to achieve fairness.
* "FairPFN" and "Cntf. Avg." models demonstrate intermediate correlation values, balancing predictive power and fairness.
* The correlation for "Race" is substantially reduced in the "CFP", "FairPFN", and "Cntf. Avg." models compared to the "Unfair" model.
* The correlation for "Sex" is relatively low across all models.
* "LSAT" and "εLSAT" show the highest correlation values overall, indicating they are strong predictors of admission outcome.
### Interpretation
This chart demonstrates the trade-off between fairness and predictive accuracy in law school admissions. The "Unfair" model, while most accurate, may perpetuate existing biases. Fairness-aware models ("CFP", "FairPFN", "Cntf. Avg.") reduce the correlation with sensitive attributes like "Race" and "Sex", but at the cost of overall predictive power. The choice of which model to use depends on the specific priorities of the institution – maximizing accuracy versus minimizing bias.
The features εUGPA and εLSAT likely represent errors or noise in the UGPA and LSAT scores, respectively. The high correlation with these features suggests that even with noise, these scores remain strong predictors. The significant drop in correlation for "Race" when using fairness constraints suggests that race is a strong predictor in the "Unfair" model, but that this predictive power can be mitigated through fairness interventions. The relatively low correlation for "Sex" across all models suggests that sex is a weaker predictor of admission outcome.