## Scatter Plot: Confidence vs. Target Length
### Overview
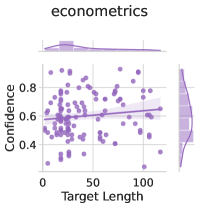
The image presents a scatter plot visualizing the relationship between "Target Length" and "Confidence". A regression line with a shaded confidence interval is overlaid on the scatter points. Marginal distributions (histograms) are displayed above and to the right of the main plot. The plot is titled "econometrics".
### Components/Axes
* **Title:** "econometrics" (top-center)
* **X-axis:** "Target Length" (bottom-center), ranging from approximately 0 to 110.
* **Y-axis:** "Confidence" (left-center), ranging from approximately 0.35 to 0.85.
* **Scatter Points:** Numerous purple dots representing individual data points.
* **Regression Line:** A dark purple line representing the trend of the data.
* **Confidence Interval:** A light purple shaded area around the regression line.
* **Marginal Distribution (Top):** A histogram showing the distribution of "Target Length".
* **Marginal Distribution (Right):** A histogram showing the distribution of "Confidence".
### Detailed Analysis
The scatter plot shows a weak positive correlation between "Target Length" and "Confidence". The regression line has a slight upward slope, indicating that as "Target Length" increases, "Confidence" tends to increase, but the relationship is not strong.
* **Regression Line Trend:** The line slopes upward, but is nearly flat.
* **Data Point Distribution:** The points are widely scattered around the regression line, indicating a high degree of variability.
* **X-axis (Target Length) Distribution:** The histogram at the top shows a distribution that is skewed to the right, with a peak around a "Target Length" of approximately 10.
* **Y-axis (Confidence) Distribution:** The histogram on the right shows a distribution that is roughly symmetrical, with a peak around a "Confidence" of approximately 0.6.
Let's attempt to extract some approximate data points from the scatter plot. Note that these are estimates due to the resolution of the image:
| Target Length (approx.) | Confidence (approx.) |
|---|---|
| 0 | 0.45 |
| 0 | 0.75 |
| 10 | 0.50 |
| 10 | 0.65 |
| 20 | 0.55 |
| 20 | 0.70 |
| 30 | 0.60 |
| 30 | 0.65 |
| 40 | 0.60 |
| 40 | 0.70 |
| 50 | 0.55 |
| 50 | 0.65 |
| 60 | 0.60 |
| 60 | 0.70 |
| 70 | 0.65 |
| 70 | 0.60 |
| 80 | 0.60 |
| 80 | 0.65 |
| 90 | 0.65 |
| 90 | 0.60 |
| 100 | 0.60 |
| 100 | 0.70 |
| 110 | 0.55 |
The regression line appears to pass through approximately (50, 0.62).
### Key Observations
* The relationship between "Target Length" and "Confidence" is weak.
* There is considerable variability in "Confidence" for a given "Target Length".
* The distribution of "Target Length" is skewed to the right.
* The distribution of "Confidence" is approximately symmetrical.
### Interpretation
The plot suggests that "Target Length" is not a strong predictor of "Confidence". While there is a slight tendency for "Confidence" to increase with "Target Length", the effect is small and there is a lot of noise in the data. The marginal distributions provide additional information about the range and distribution of each variable. The right-skewed distribution of "Target Length" indicates that most observations have relatively short target lengths, with a few observations having much longer target lengths. The approximately symmetrical distribution of "Confidence" suggests that confidence levels are centered around a value of approximately 0.6. The title "econometrics" suggests that this data may be related to economic modeling or analysis, potentially examining the confidence in predictions or forecasts based on the length of the target variable. The weak correlation could indicate that other factors are more important in determining confidence.