## Chart Type: Line Graphs Comparing Latency and TPOT
### Overview
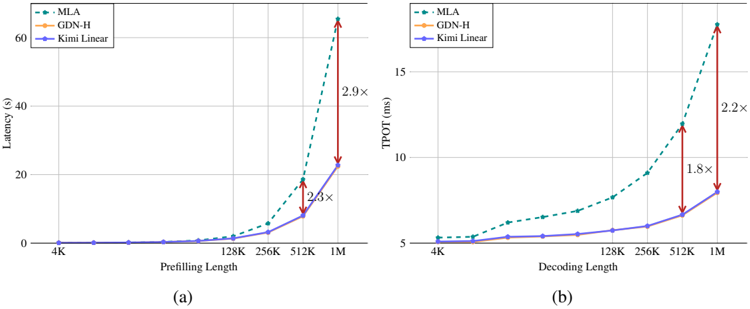
The image contains two line graphs comparing the performance of three different models (MLA, GDN-H, and Kimi Linear) in terms of latency and TPOT (likely Throughput Over Time). The left graph (a) shows latency (in seconds) as a function of prefilling length, while the right graph (b) shows TPOT (in milliseconds) as a function of decoding length. Both graphs use a logarithmic scale on the x-axis.
### Components/Axes
**Left Graph (a):**
* **Y-axis:** Latency (s), ranging from 0 to 60 seconds.
* **X-axis:** Prefilling Length, with values 4K, 128K, 256K, 512K, and 1M.
* **Legend (top-left):**
* MLA: Dashed teal line with circular markers.
* GDN-H: Solid orange line with circular markers.
* Kimi Linear: Solid purple line with circular markers.
**Right Graph (b):**
* **Y-axis:** TPOT (ms), ranging from 5 to 15 milliseconds.
* **X-axis:** Decoding Length, with values 4K, 128K, 256K, 512K, and 1M.
* **Legend (top-left):**
* MLA: Dashed teal line with circular markers.
* GDN-H: Solid orange line with circular markers.
* Kimi Linear: Solid purple line with circular markers.
### Detailed Analysis
**Left Graph (a) - Latency vs. Prefilling Length:**
* **MLA (Dashed Teal):** Latency remains near 0 until 128K, then increases sharply.
* 4K: ~0s
* 128K: ~1s
* 256K: ~3s
* 512K: ~10s
* 1M: ~30s
* **GDN-H (Solid Orange):** GDN-H is not visible on the graph, suggesting it has very high latency values.
* **Kimi Linear (Solid Purple):** Latency remains near 0 until 256K, then increases.
* 4K: ~0s
* 128K: ~0s
* 256K: ~0.5s
* 512K: ~4s
* 1M: ~10s
* **Annotations:**
* A red double-arrow indicates the difference between MLA and Kimi Linear at 512K, labeled "2.3x".
* A red double-arrow indicates the difference between MLA and Kimi Linear at 1M, labeled "2.9x".
**Right Graph (b) - TPOT vs. Decoding Length:**
* **MLA (Dashed Teal):** TPOT increases gradually with decoding length.
* 4K: ~5ms
* 128K: ~6ms
* 256K: ~7ms
* 512K: ~9ms
* 1M: ~11ms
* **GDN-H (Solid Orange):** GDN-H is not visible on the graph, suggesting it has very low TPOT values.
* **Kimi Linear (Solid Purple):** TPOT increases gradually with decoding length.
* 4K: ~5ms
* 128K: ~5ms
* 256K: ~5.5ms
* 512K: ~6.5ms
* 1M: ~8ms
* **Annotations:**
* A red double-arrow indicates the difference between MLA and Kimi Linear at 512K, labeled "1.8x".
* A red double-arrow indicates the difference between MLA and Kimi Linear at 1M, labeled "2.2x".
### Key Observations
* In the Latency graph, MLA's latency increases more rapidly than Kimi Linear's as prefilling length increases.
* In the TPOT graph, MLA's TPOT is consistently higher than Kimi Linear's as decoding length increases.
* GDN-H is not visible on either graph, suggesting it has very poor performance in both latency and TPOT.
* The annotations on both graphs highlight the increasing performance gap between MLA and Kimi Linear at higher lengths.
### Interpretation
The data suggests that MLA generally outperforms Kimi Linear in both latency and TPOT, especially at larger prefilling/decoding lengths. The annotations emphasize this performance gap. The absence of GDN-H from the graphs indicates that it is significantly less efficient than both MLA and Kimi Linear, making it an unsuitable choice for these tasks. The logarithmic scale on the x-axis suggests that the performance differences become more pronounced as the input length increases. The "x" values on the red arrows indicate a multiplicative factor, showing how much larger the MLA value is compared to the Kimi Linear value at those specific points.