## Heatmap/Bar Chart: Importance Score Across Reasoning Steps
### Overview
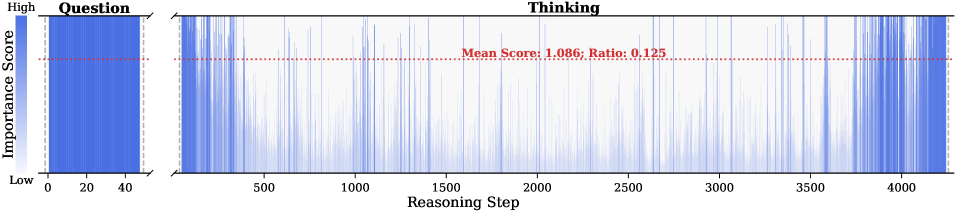
The image is a horizontal heatmap or bar chart visualizing the "Importance Score" of different "Reasoning Steps" in a process. The chart is divided into two distinct sections: a narrow "Question" phase and a much longer "Thinking" phase. A horizontal red dashed line indicates the mean score across the "Thinking" phase.
### Components/Axes
* **Y-Axis (Vertical):** Labeled **"Importance Score"**. The scale is qualitative, marked with **"High"** at the top and **"Low"** at the bottom. There are no numerical tick marks on this axis.
* **X-Axis (Horizontal):** Labeled **"Reasoning Step"**. It is a numerical scale with major tick marks at: 0, 20, 40, 500, 1000, 1500, 2000, 2500, 3000, 3500, and 4000.
* **Section Labels:**
* **"Question"**: Positioned above the leftmost segment of the chart (approximately steps 0-40).
* **"Thinking"**: Positioned above the main, rightward segment of the chart (approximately steps 500-4000).
* **Annotation:** A red dashed horizontal line spans the "Thinking" section. Above this line, centered, is the text: **"Mean Score: 1.086; Ratio: 0.125"**.
* **Legend/Color Scale:** A vertical color bar is implied on the far left. Dark blue represents a **"High"** importance score, fading to white/light blue for a **"Low"** importance score.
### Detailed Analysis
The chart displays data as vertical bars or a continuous heatmap where color intensity corresponds to the importance score.
1. **"Question" Phase (Steps ~0-40):**
* **Trend:** This section is a solid, uniform block of dark blue.
* **Data Points:** Every reasoning step within this range has a consistently **high importance score**. There is no visible variation.
2. **"Thinking" Phase (Steps ~500-4000):**
* **Trend:** This section shows a highly variable pattern. The color fluctuates rapidly between dark blue (high importance) and white/light blue (low importance) across the 3500+ steps.
* **Data Distribution:** High-importance scores (dark blue spikes) appear scattered throughout the entire range. There are clusters of higher activity (e.g., around steps 500-700, 1200-1400, 2800-3000, and 3600-4000), but no single, dominant trend of increasing or decreasing importance over the long term.
* **Statistical Annotation:** The red dashed line and its label provide summary statistics for this phase:
* **Mean Score:** 1.086 (This is a numerical value, suggesting the underlying importance score is quantified on a scale where ~1 is the average for the "Thinking" phase).
* **Ratio:** 0.125 (This likely represents the proportion of steps in the "Thinking" phase that are considered "high importance," perhaps those scoring above a certain threshold).
### Key Observations
* **Bimodal Pattern:** The process exhibits two clear modes: a short, uniformly critical "Question" phase and a long, variably important "Thinking" phase.
* **High Variability in Thinking:** The "Thinking" phase is not monolithic; importance spikes and drops frequently, indicating that specific steps within reasoning are more pivotal than others.
* **Meaning of the Ratio:** A ratio of 0.125 (or 1/8th) suggests that only about 12.5% of the steps in the extended "Thinking" process are of high importance, highlighting the efficiency or sparsity of critical operations within a larger computational flow.
* **Spatial Layout:** The "Question" section is compressed on the far left, visually emphasizing its brevity compared to the expansive "Thinking" process. The mean score line is positioned in the upper half of the "Thinking" section's vertical space, indicating the mean importance score (1.086) is relatively high on the "Low" to "High" scale.
### Interpretation
This chart likely visualizes the internal attention or importance weighting of a reasoning model (like a large language model) as it processes a query.
* **What it suggests:** The model dedicates intense, uniform focus to understanding the initial **"Question"**. The subsequent **"Thinking"** or reasoning process involves a long chain of steps where the model's "attention" or the computational importance is highly selective. Most steps are of low importance (background processing), with intermittent spikes where key inferences, connections, or decisions are made.
* **Relationship between elements:** The "Question" sets the stage with high importance, defining the problem space. The "Thinking" phase then executes a complex, non-linear reasoning trajectory where importance is not evenly distributed. The mean score and ratio quantify the overall intensity and sparsity of this process.
* **Notable insight:** The stark contrast between the two phases underscores a fundamental principle in complex reasoning: problem definition ("Question") is uniformly critical, while the solution path ("Thinking") involves many low-stakes steps punctuated by a few high-stakes cognitive operations. The ratio of 0.125 provides a potential metric for the "cognitive efficiency" or "focus density" of the model's reasoning algorithm.