# Technical Document: Visual Encoder Size vs LLM Size Chart Analysis
## 1. Chart Title
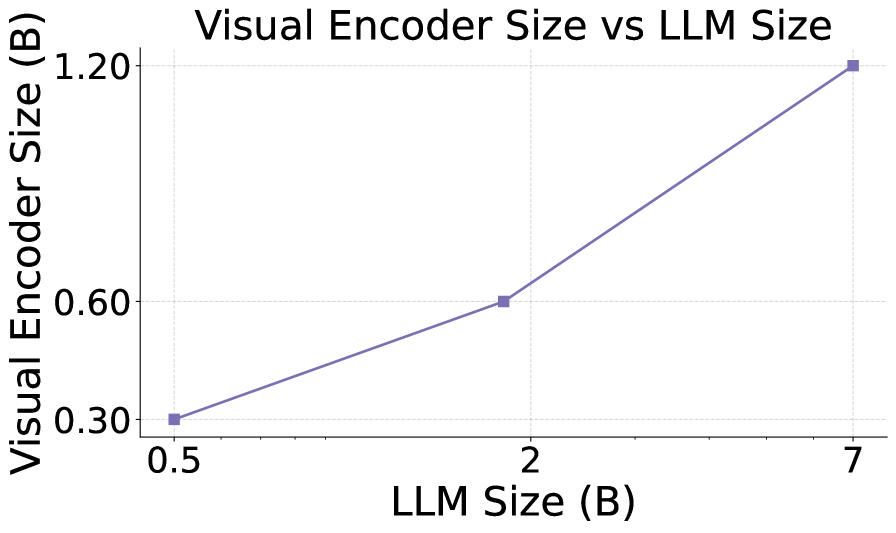
- **Title**: "Visual Encoder Size vs LLM Size"
## 2. Axis Labels and Scales
- **X-Axis (Horizontal)**:
- **Label**: "LLM Size (B)"
- **Range**: 0.5 to 7 (in increments of 1.5)
- **Tick Marks**: 0.5, 2, 3.5, 5, 6.5, 7
- **Y-Axis (Vertical)**:
- **Label**: "Visual Encoder Size (B)"
- **Range**: 0.30 to 1.20 (in increments of 0.30)
- **Tick Marks**: 0.30, 0.60, 0.90, 1.20
## 3. Data Points and Line
- **Line Style**:
- **Color**: Purple
- **Marker**: Square (■)
- **Trend**: Linear, positive slope (increasing from left to right)
- **Data Points**:
1. **[0.5, 0.30]**: X=0.5, Y=0.30
2. **[2, 0.60]**: X=2, Y=0.60
3. **[7, 1.20]**: X=7, Y=1.20
## 4. Chart Components
- **Grid**: Dashed lines (horizontal and vertical) for reference.
- **Legend**: **Not present** in the image.
- **Background**: White with gridlines.
## 5. Trend Verification
- The line exhibits a **linear relationship** between LLM Size (X-axis) and Visual Encoder Size (Y-axis). As LLM Size increases, Visual Encoder Size increases proportionally.
## 6. Spatial Grounding
- **Legend Placement**: **Not applicable** (no legend exists).
- **Data Point Colors**: All data points match the purple line color.
## 7. Component Isolation
- **Header**: Chart title centered at the top.
- **Main Chart**:
- X-axis and Y-axis with labels and scales.
- Line with markers connecting data points.
- **Footer**: No additional text or elements.
## 8. Additional Observations
- The chart uses a **1:1 aspect ratio** for clarity.
- No textual annotations or subcategories are present.
- The relationship between variables is **directly proportional** (slope ≈ 0.15 per unit increase in LLM Size).
## 9. Data Table Reconstruction
| LLM Size (B) | Visual Encoder Size (B) |
|--------------|--------------------------|
| 0.5 | 0.30 |
| 2 | 0.60 |
| 7 | 1.20 |
## 10. Language and Transcription
- **Primary Language**: English.
- **No other languages** are present in the image.
## 11. Critical Notes
- The chart explicitly shows a **linear correlation** between LLM Size and Visual Encoder Size.
- No anomalies or outliers are observed in the data points.
- The absence of a legend suggests a single data series is represented.